Meaning and Covariation in 300 Personality Items
AI co-author: OpenAI Codex (GPT-6)
Prompter: Denny Borsboom
Department of Psychology, University of Amsterdam, Amsterdam, The Netherlands
October 30, 2026 · Correspondence: Denny Borsboom, University of Amsterdam; D.Borsboom@uva.nl
Abstract
Semantic similarity between personality items may help explain their empirical correlations, but measuring this similarity requires an explicit operationalization. We use text embeddings, numerical representations of item wording produced by a language model, to study this correspondence in the 300-item IPIP-NEO. Correlations between embedding vectors operationalize semantic similarity; correlations among responses describe empirical associations. Using 7,325 complete records from Johnson's public archive and bootnet for network estimation and respondent resampling, we compare the two across 44,850 item pairs. Zero-order embedding correlations correlated 0.377 with absolute empirical zero-order correlations. Absolute partial embedding correlations correlated 0.343 with absolute empirical partial correlations. The corresponding rank correlations were 0.303 and 0.046, showing that the partial comparison offers little agreement in the overall ordering of pairs. Larger absolute embedding correlations accompanied both stronger positive and stronger negative empirical associations. Exploratory curved fits describe these patterns while respecting the bounds on absolute correlations. The findings support a correspondence between the operational measure of semantic similarity and response patterns. They do not establish whether language shapes personality judgments, reflects behavioral regularities, or both.
Keywords: personality; IPIP-NEO; semantic similarity; text embeddings; partial correlation; psychological networks
Introduction
Semantic relations between test items are relationships between what the items mean. These relations matter for psychometrics: two items may express nearly the same idea, describe different aspects of a concept, or make opposing statements about it. Such differences affect how we interpret correlations among responses and the scores formed from them. The validity literature connects statistical evidence with questions about item content, response processes, and score interpretation (Messick, 1989, 1995). Markus and Borsboom (2013) place meaning alongside measurement and causation as a central problem of test validity. Studying the relationship between item meanings and response patterns is therefore part of understanding what a test measures.
Personality provides a particularly interesting case. Correlations among personality items are often interpreted as evidence for traits, but overlapping meanings may also contribute to those correlations. Shweder and D'Andrade's (1980) systematic distortion hypothesis proposed that relationships among personality concepts can shape memory-based judgments, making behavior appear more coherent than direct observation would suggest. Romer and Revelle (1984) challenged the inference that this makes traits fictitious: semantic relationships can coexist with real regularities in behavior. The question is how closely relations among descriptions correspond to relations among responses, and what that correspondence can tell us about personality measurement.
This paper develops text embeddings as a methodology for studying the alignment between semantic similarity and empirical relations among items. The study is a preliminary investigation of the feasibility of comparing semantic relations between items with empirical correlations. Semantic similarity is the construct of interest; embeddings provide an operational measure of it. Here, similarity includes shared subject matter, which can occur in descriptions that take opposing positions on the same topic. We apply the method to the 300-item IPIP-NEO, which covers five broad personality domains and 30 narrower facets (Johnson, 2014). Complete item wording and response records allow a comparison for every item pair. We examine both the strength and direction of empirical associations, and ask how the correspondence changes when information shared with the other items is removed. Comparable network displays show the resulting patterns of connections.
This paper is organized as follows. The Method section introduces the data, explains how embeddings operationalize semantic similarity, and describes the empirical correlations and comparison procedures. The Results section presents correlations across item pairs, scatterplots, and network displays. The Discussion considers what these findings imply for semantic similarity and personality measurement. Appendix A provides computational details and supplementary analyses, and Appendix B lists all 300 items.
Method
Data, item matching, and response direction
We used ipip20993.sav and its codebook from Johnson's public OSF component for the 2005 study (Johnson, n.d., 2005). It contains 20,993 response records from an online personality study. We used the deposited sample without additional demographic, personality-score, or response-consistency filters; we did not reconstruct the source study's screening decisions.
The scoring workbook (Johnson, n.d.) supplies each item's number, exact text, facet, and scoring direction. Its rows begin with items selected for a shorter questionnaire, so we sorted by full-form item number before matching the 300 response columns. We checked wording against Johnson's printable questionnaire and scoring directions against a separate workbook from the same repository. There are ten items per facet and 60 per domain. Appendix B lists every item used.
Negatively keyed items had already been reverse scored in the source data. We first treated zero responses as missing, then applied \(6 - x\) to those columns to restore agreement with the displayed wording: 1 means very inaccurate and 5 very accurate. Thus a high response indicates endorsement of the statement, including when it describes the lower end of a trait. This matches the direction of the responses to the text given to the embedding model.
There were 33,690 missing item responses. Requiring complete responses retained 7,325 records, so all primary correlations refer to the same respondents. A planned sensitivity analysis uses all available responses for each pair, with pairwise sample sizes ranging from 16,817 to 20,947. Neither approach establishes that missingness is unrelated to the quantities being studied.
Operationalizing semantic similarity with embedding correlations
An embedding is a list of numbers that a language model assigns to a piece of text using patterns learned from large collections of text. The list represents the text as a vector in a space with many dimensions. Individual dimensions need not correspond to named concepts or traits. We operationalize semantic similarity between two items by comparing the directions of their embedding vectors: closer directions receive higher scores.
We used the locally running model text-embedding-jina-embeddings-v5-text-small-text-matching (Akram et al., 2026) to obtain a 1,024-number vector for each exact item statement. Each input began with Document:, as required by the model setup. The model received item text without response data or trait labels. We saved the exact requests, responses, and vectors, allowing reproduction without downloading or running the model.
The comparison between two vectors is their cosine similarity, which ranges from -1 to 1. We call this the zero-order embedding correlation, or simply embedding correlation. It is an uncentered correlation: the vectors are scaled to unit length without subtracting their coordinate means. It is therefore distinct from a centered Pearson correlation across embedding coordinates and from a correlation among respondents. All zero-order embedding correlations in this dataset were positive, approximately .233 to .949. Their interpretation as a measure of semantic similarity remains a substantive assumption; a model's representation need not capture every aspect of meaning relevant to respondents.
We also calculate partial embedding correlations. For each pair, we remove from both vectors the components accounted for by the other 298 item vectors and calculate the cosine between the remaining vectors. This operationalizes similarity in the information that remains after adjustment for this particular item set. Values can be positive or negative. The calculation runs through bootnet's custom-estimator interface and is mathematically well defined here. Embedding coordinates are model features, however, not independently sampled people. We do not treat the 1,024 coordinates as a sample size, bootstrap them, or interpret a zero partial embedding correlation as psychological conditional independence. Appendix A gives the formulas and numerical checks.
Empirical correlations and partial correlations
All network estimation and respondent resampling use bootnet version 1.9.1 (Epskamp et al., 2018). The primary empirical networks contain Pearson zero-order correlations and partial correlations, with no weights set to zero by a selection rule. A zero-order correlation describes the association between responses to two items. A partial correlation describes their association after linear adjustment for responses to the other 298 items. It can be understood as the correlation between the unexplained parts of each response after predicting it from those other items. It does not establish a causal effect or, without further assumptions, conditional independence.
The primary analysis treats the five response categories as equally spaced. Planned sensitivity analyses use Spearman correlations, which compare response ranks, and the available respondents for each item pair.
Comparing empirical and embedding correlations
The 300 items yield 44,850 distinct pairs. Each pair has an empirical correlation and an embedding correlation. We correlate these two lists to ask whether pairs with larger embedding correlations also have stronger empirical associations. Thus a correlation between two items is one data point in a second calculation: the correlation across all item pairs between the empirical and embedding measures. The main figures match zero-order measures with each other and partial measures with each other. Table 1 also reports the two cross comparisons.
Related wording need not imply positive empirical correlations: "Often feel blue" and "Seldom feel blue" concern the same experience while describing opposing frequencies. We therefore distinguish strength from direction. Figure 1 uses absolute empirical correlations, which measure strength regardless of sign. Its horizontal axis uses zero-order embedding correlations, all positive here, or absolute partial embedding correlations. Figure 2 uses the same horizontal axes while retaining empirical signs and separating positive and negative pairs. Table 1 additionally reports agreement with both measures' original signs retained.
We report Pearson correlations across pairs to summarize linear agreement and Spearman correlations to summarize agreement in their ordering. Because the scatterplots suggest curvature, we also fit quadratic trend curves. Ordinary polynomial regression can predict values below zero; our curves instead fit a quadratic on a transformed scale and map its predictions back into the interval from 0 to 1. Figure 1 uses one curve per panel. Figure 2 fits absolute empirical correlations separately within each sign group and displays the negative group's fitted values below zero. These curves describe patterns in the observed data; they do not change the reported Pearson or Spearman correlations. Appendix A specifies the transformation and fitting procedure.
Pairs share items, so the 44,850 observations are not independent. We do not use ordinary regression significance tests or confidence bands that assume independent pairs. For the planned signed comparisons, a quadratic assignment procedure (QAP) supplies a permutation reference by shuffling the item labels that match the embedding and empirical matrices while preserving each matrix's internal structure. A further comparison removes average differences associated with facet membership and scoring direction. The magnitude comparisons, sign separation, and curved fits were developed after inspecting the data and are exploratory.
Respondent resampling and network displays
For each primary empirical network, bootnet drew 500 samples of respondents with replacement, re-estimated the network, and recalculated agreement with the fixed embedding correlations. Reported ranges contain the central 95% of these bootstrap values. They describe respondent resampling with the item set and embeddings held fixed. For empirical partial correlations, the bootstrap agreement values were systematically below the full-sample estimates. We therefore treat the ranges as diagnostics, rather than calibrated confidence intervals. Resampling may add estimation noise to the nonlinear partial-correlation calculation, but we did not establish this explanation or apply a bias correction.
All four network panels show the same 300 items in one saved layout, grouped and colored by domain, with facets grouped within domains. Each panel displays its 449 strongest absolute connections, the top 1% rounded up. Positions, sign colors, and the mapping from weights to line widths are identical across panels. This display filter applies only to the pictures; all 44,850 pairs enter the numerical comparisons.
Results
Agreement in association strength
Zero-order embedding correlations correlated 0.377 with absolute empirical zero-order correlations. Absolute partial embedding correlations correlated 0.343 with absolute empirical partial correlations (Table 1; Figure 1). With all signs retained, the respective correlations were 0.227 and 0.109. Agreement in strength was therefore greater than agreement in direction for both matched comparisons.
Spearman agreement in strength was 0.303 for the zero-order comparison and 0.046 for the partial comparison. The small latter value matters: a Pearson correlation of 0.343 does not imply similar ordering across all pairs. Most partial correlations cluster near zero, with larger values concentrated in a much smaller set of pairs. The curved fits describe an increase in absolute empirical correlations toward the upper end of the embedding measures, with substantial dispersion around the curves. The upper ends, particularly for the partial comparison, contain few pairs and provide less support for the fitted shape.
Table 1. Agreement between empirical and embedding correlations. Strength agreement correlates absolute empirical and absolute embedding values; all zero-order embedding values are positive here. Signed agreement retains both measures' original signs. Each agreement statistic is a Pearson correlation across 44,850 pairs. Ranges contain the central 95% of respondent-bootstrap strength-agreement values. The two partial empirical estimates exceed their ranges, which are resampling diagnostics rather than calibrated confidence intervals. Cross comparisons are included for completeness.
| Empirical measure | Embedding measure | Strength agreement | 95% resampling range | Signed agreement |
|---|---|---|---|---|
| Zero order | Zero order | 0.377 | [0.372, 0.379] | 0.227 |
| Zero order | Partial | 0.189 | [0.186, 0.190] | 0.076 |
| Partial | Zero order | 0.258 | [0.229, 0.237] | 0.157 |
| Partial | Partial | 0.343 | [0.315, 0.324] | 0.109 |
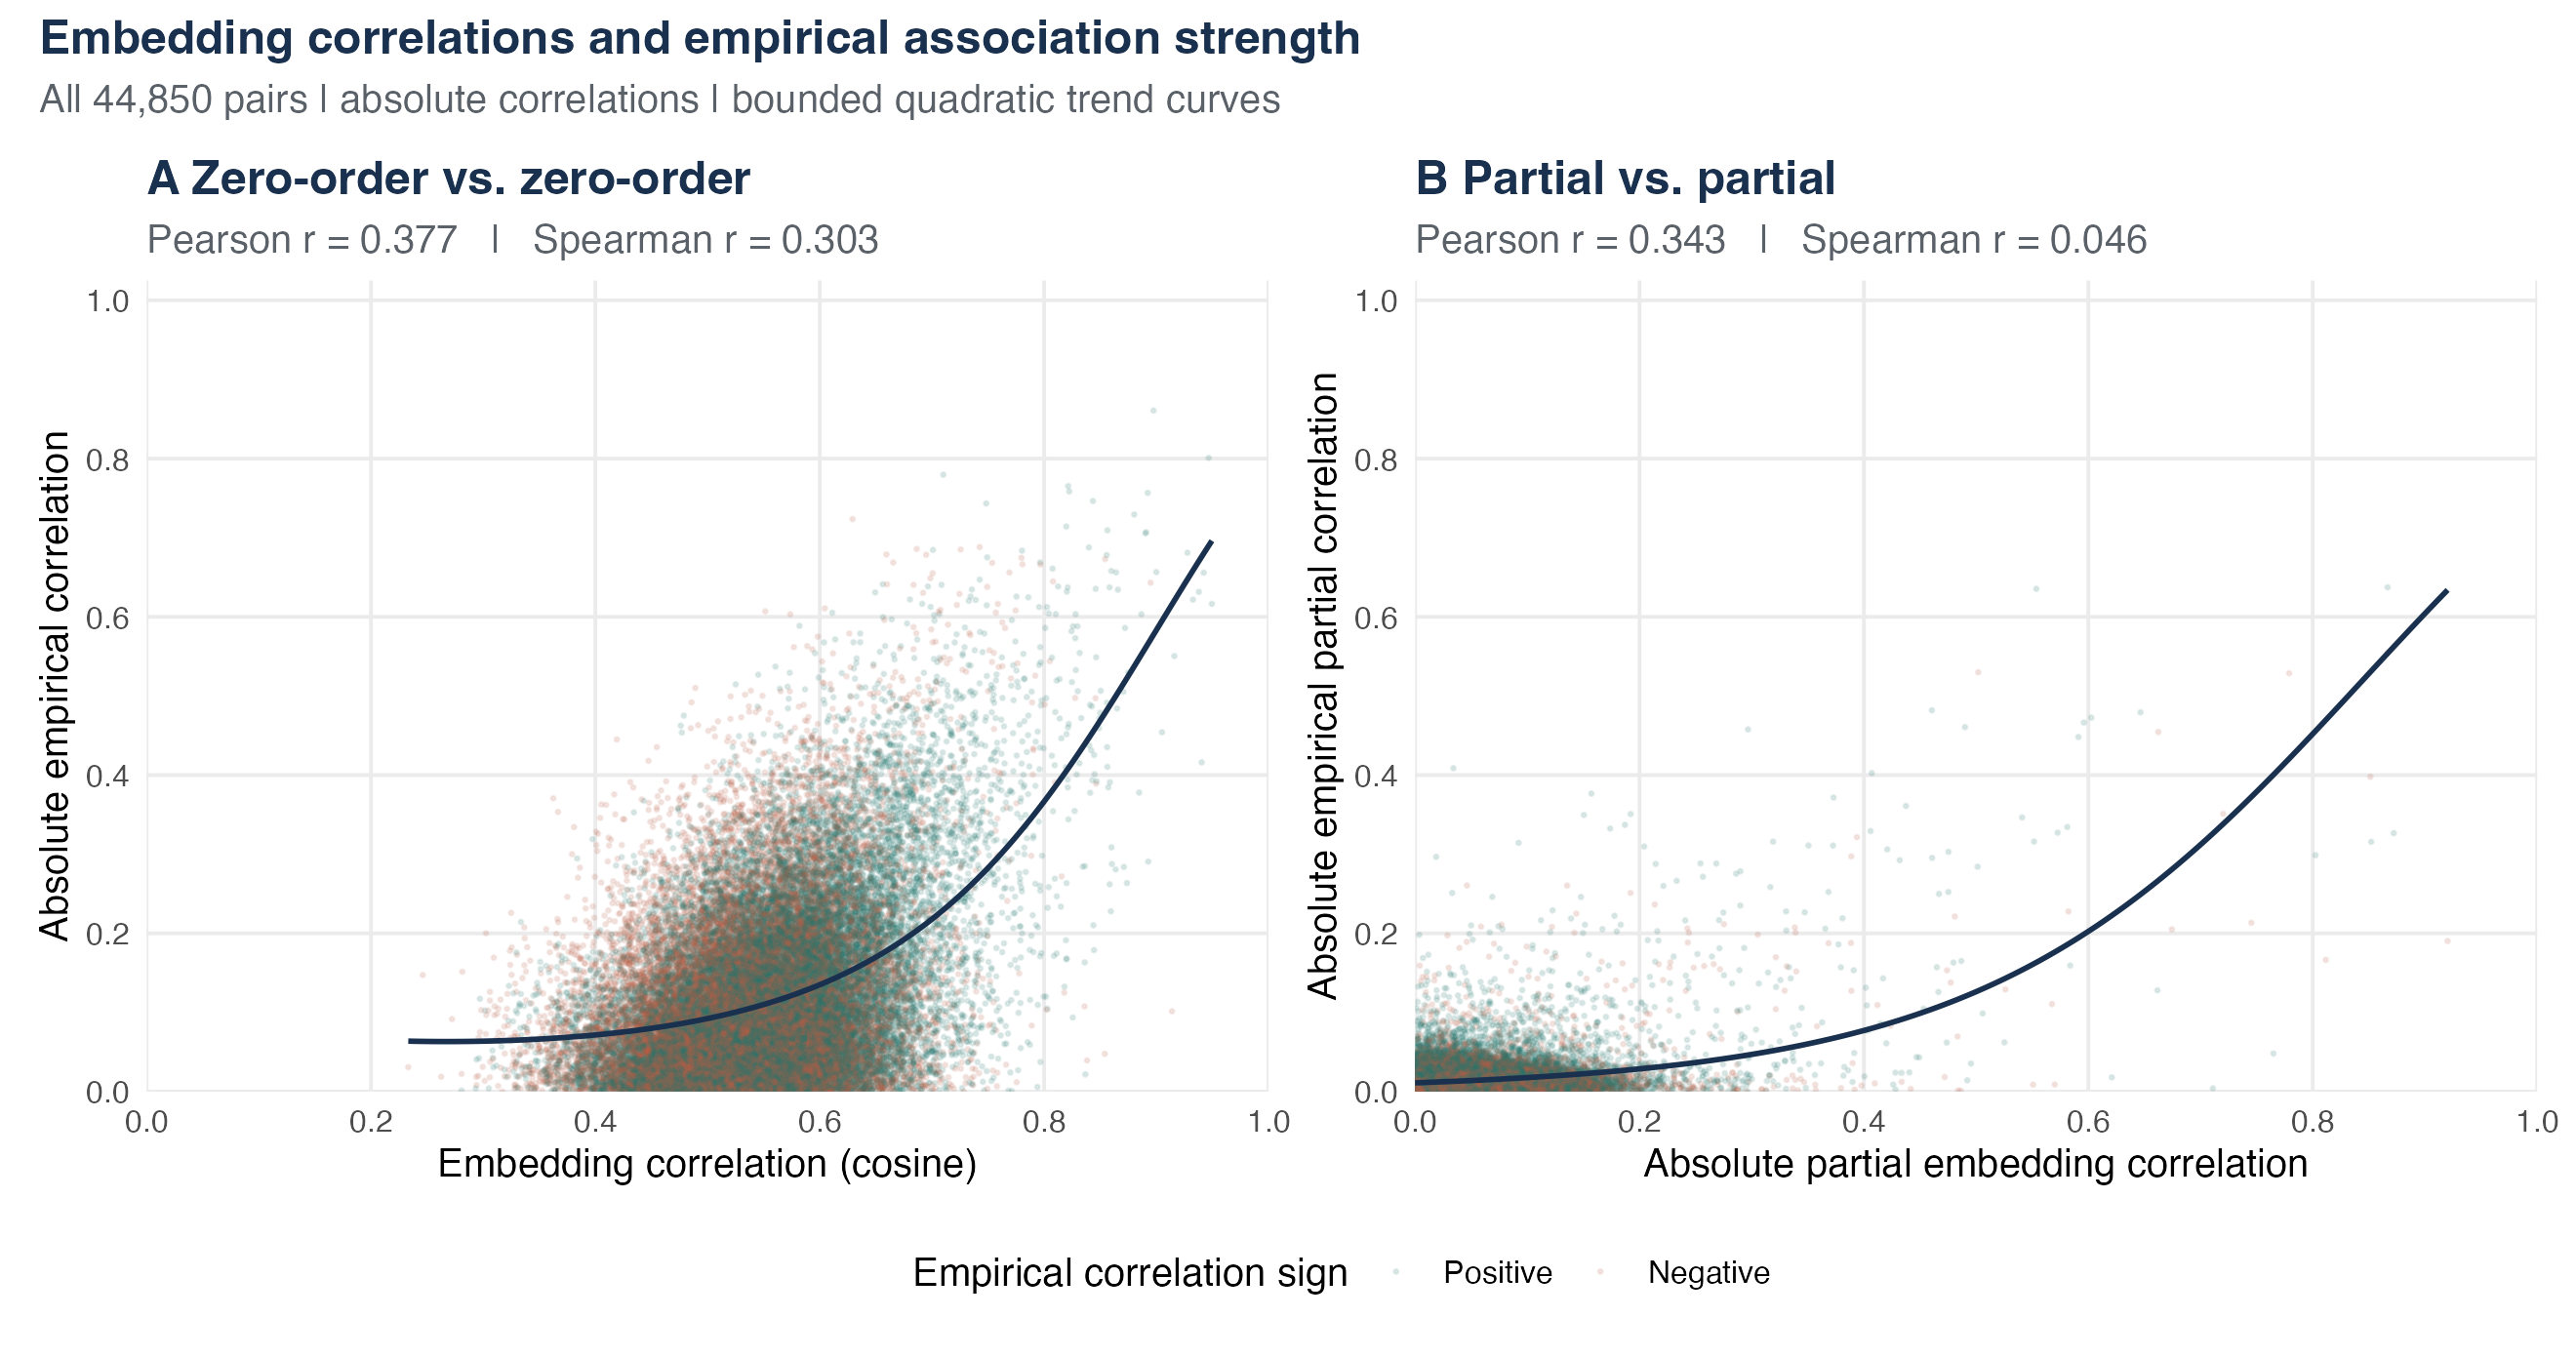
Figure 1: Embedding correlations and empirical association strength across all 44,850 item pairs. Panel A matches zero-order measures; panel B matches partial measures. Each point represents an item pair. Empirical correlations are absolute in both panels, and partial embedding correlations are also absolute. Green and terracotta identify positive and negative empirical correlations. Navy curves are quadratic fits on a logit scale, mapped back to the interval from 0 to 1. Curves extend only across the observed predictor range. Pearson and Spearman values describe agreement across pairs, not the fit of the curves. Both panels use identical axes, with the vertical axis starting at zero.
Positive and negative empirical correlations diverge
Among the 23,995 pairs with positive zero-order empirical correlations, their correlation with the embedding measure was 0.462. Among the 20,855 negative pairs, it was -0.253. For partial correlations, the corresponding values using absolute partial embedding correlations were 0.368 among 24,161 positive pairs and -0.304 among 20,689 negative pairs (Figure 2).
Larger embedding magnitudes thus accompany empirical associations farther from zero in either direction. The groups are defined by their observed empirical signs; their separate curves do not establish distinct mechanisms. No empirical pair had an exact zero correlation.
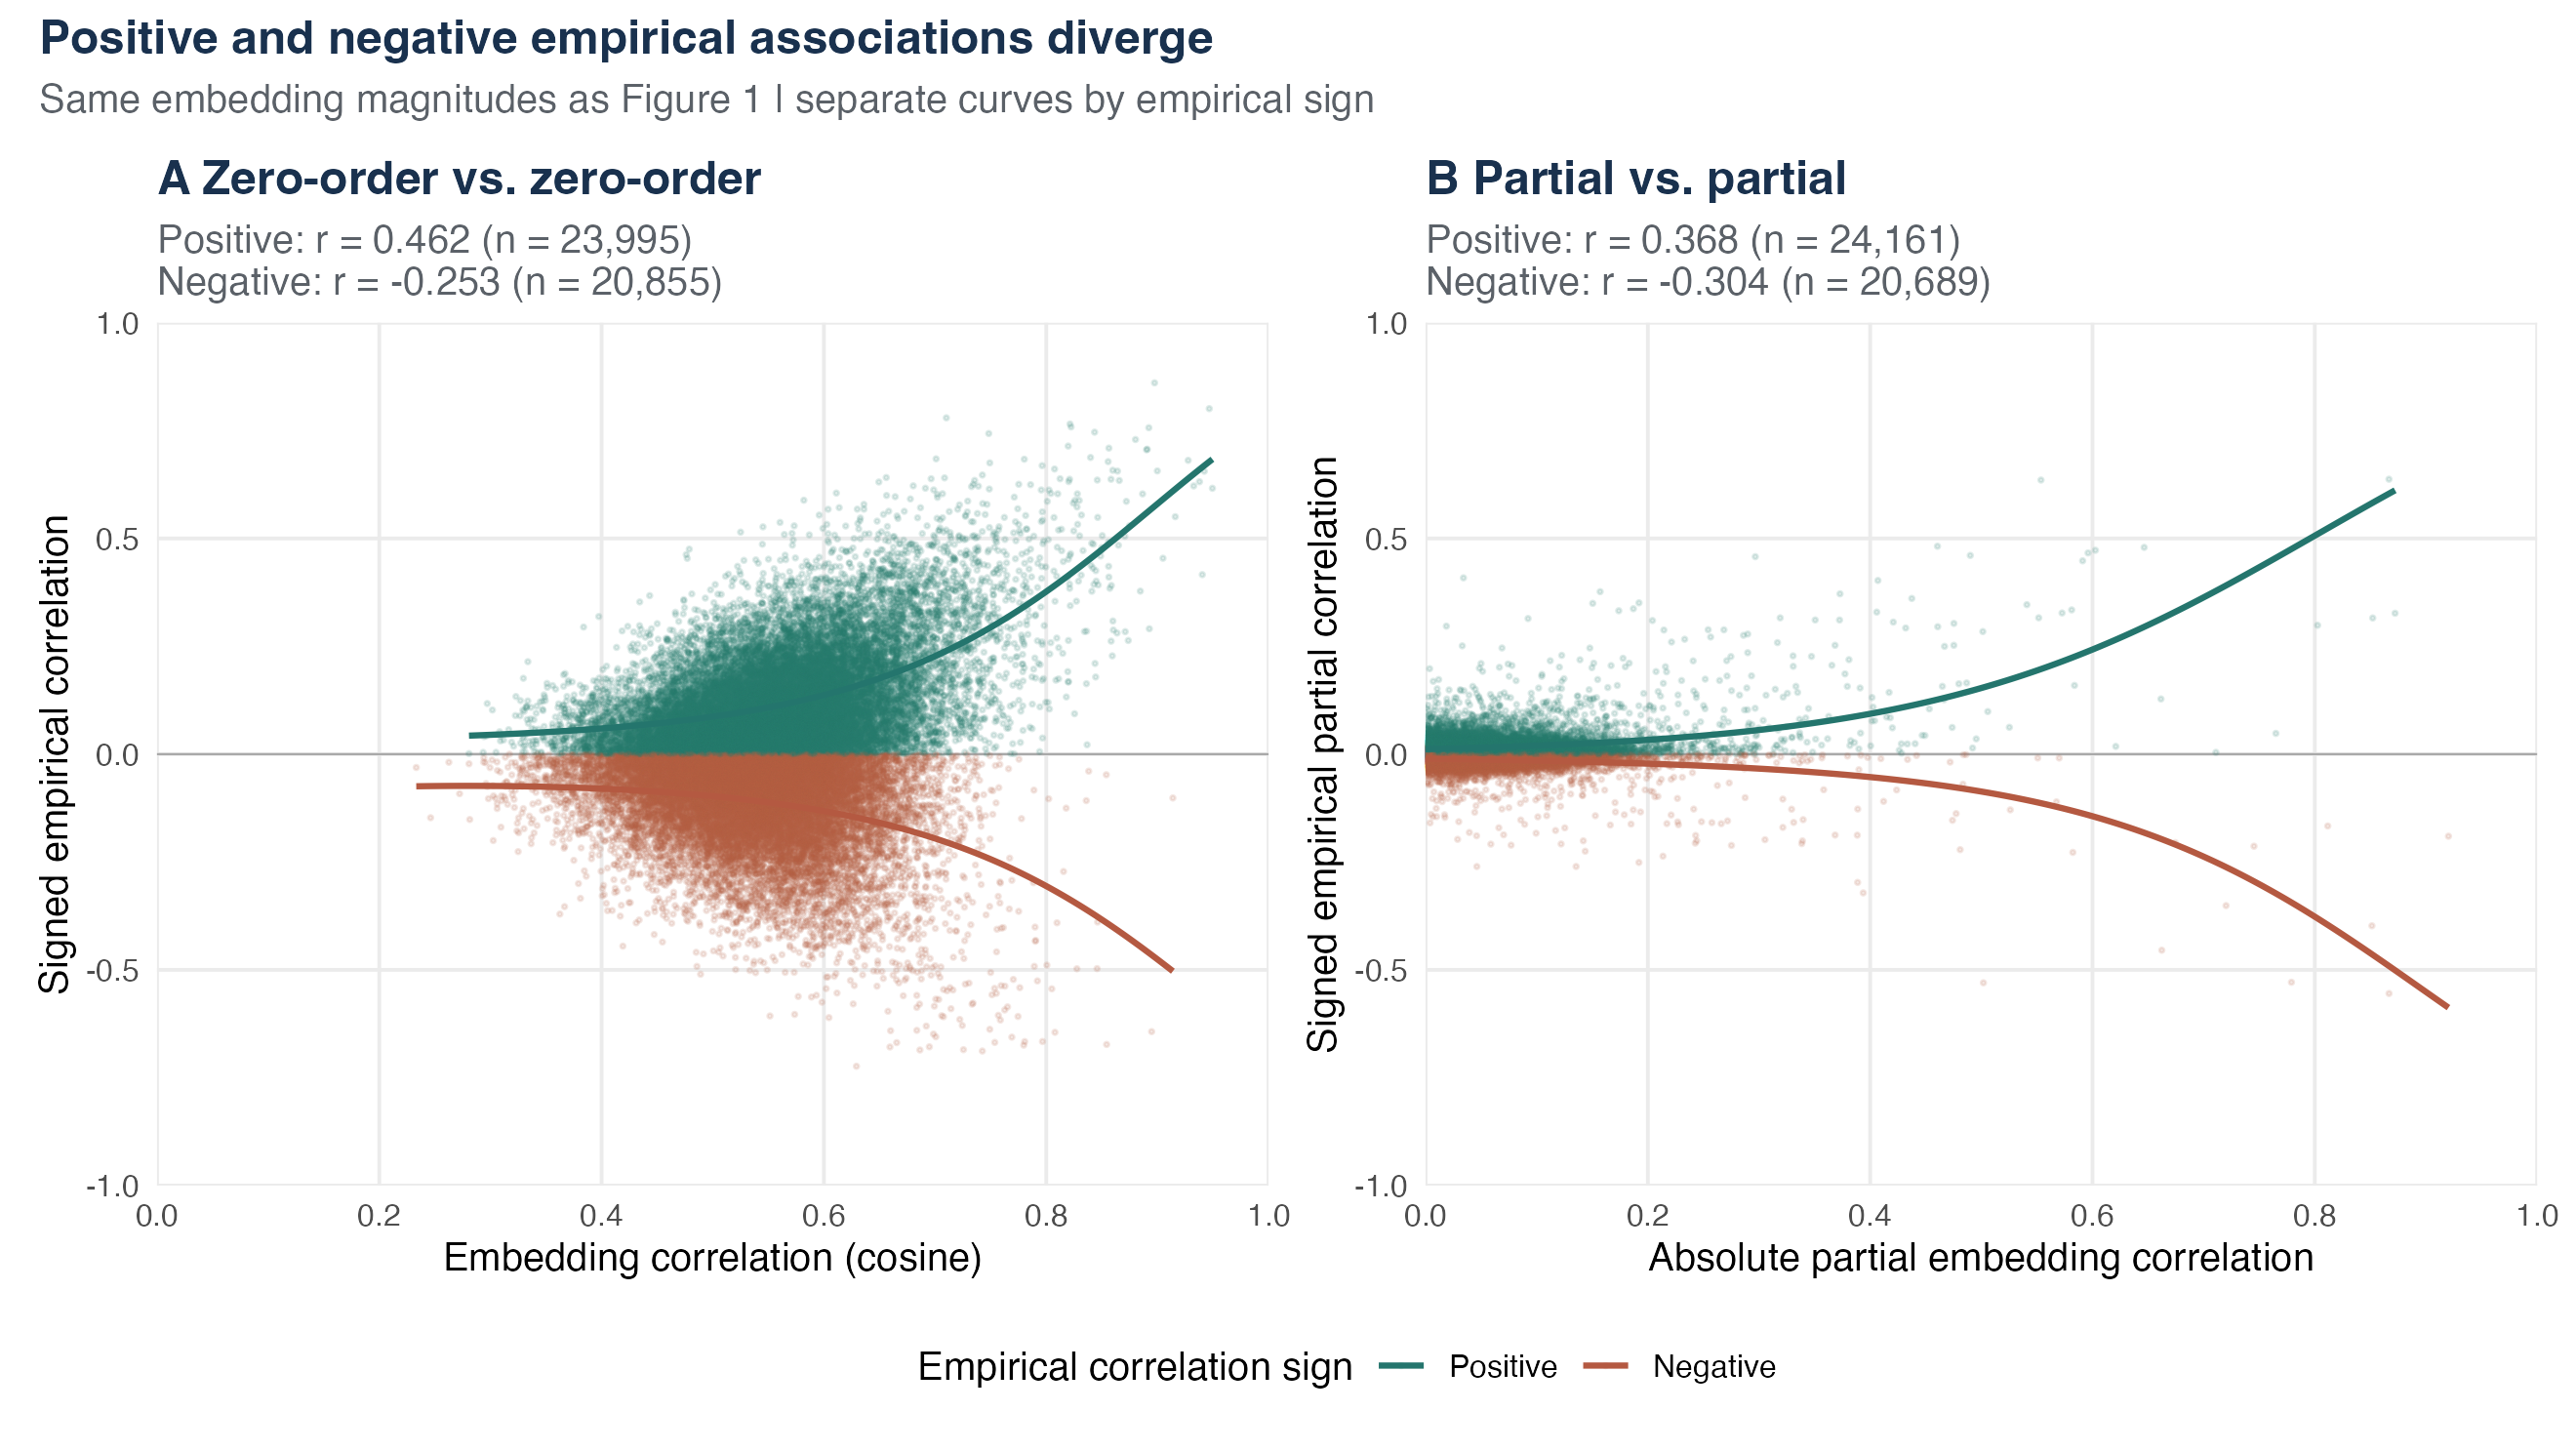
Figure 2: The two directions underlying Figure 1. The horizontal axes are unchanged: zero-order embedding correlations in panel A and absolute partial embedding correlations in panel B. Empirical correlations retain their signs. Green and terracotta curves are fitted separately to the magnitudes of positive and negative empirical correlations, with the latter reflected below zero. Correlations printed above each panel compare its horizontal measure with signed empirical values within each group; n counts item pairs. The axes are identical across panels.
Table 2 illustrates how high embedding correlations can accompany either empirical direction. "Get irritated easily" and "Get upset easily" correlate positively; "Often feel blue" and "Seldom feel blue" correlate negatively. The examples are the highest zero-order embedding correlations among pairs with empirical correlations above .30 and below -.30, respectively.
Table 2. High embedding correlations with positive or negative empirical correlations. Item numbers refer to Appendix B. Both numerical measures are zero-order. The wording is reproduced exactly from the item key.
| Pair and wording | Embedding correlation | Empirical \( r \) |
|---|---|---|
| I036: Get irritated easily. / I066: Get upset easily. | 0.949 | 0.616 |
| I011: Often feel blue. / I221: Seldom feel blue. | 0.895 | -0.643 |
Network patterns and resampling diagnostics
Figure 3 displays the four networks in identical positions. The strongest empirical connections do not simply reproduce the strongest embedding connections. Adjusting for the other items changes which pairs are most strongly connected, as well as their signs and weights. The domain and facet groups reflect the questionnaire key; they are not clusters discovered by the analysis. Equal displayed edge counts do not imply equal thresholds or statistical significance. Each panel reports its smallest displayed absolute weight.
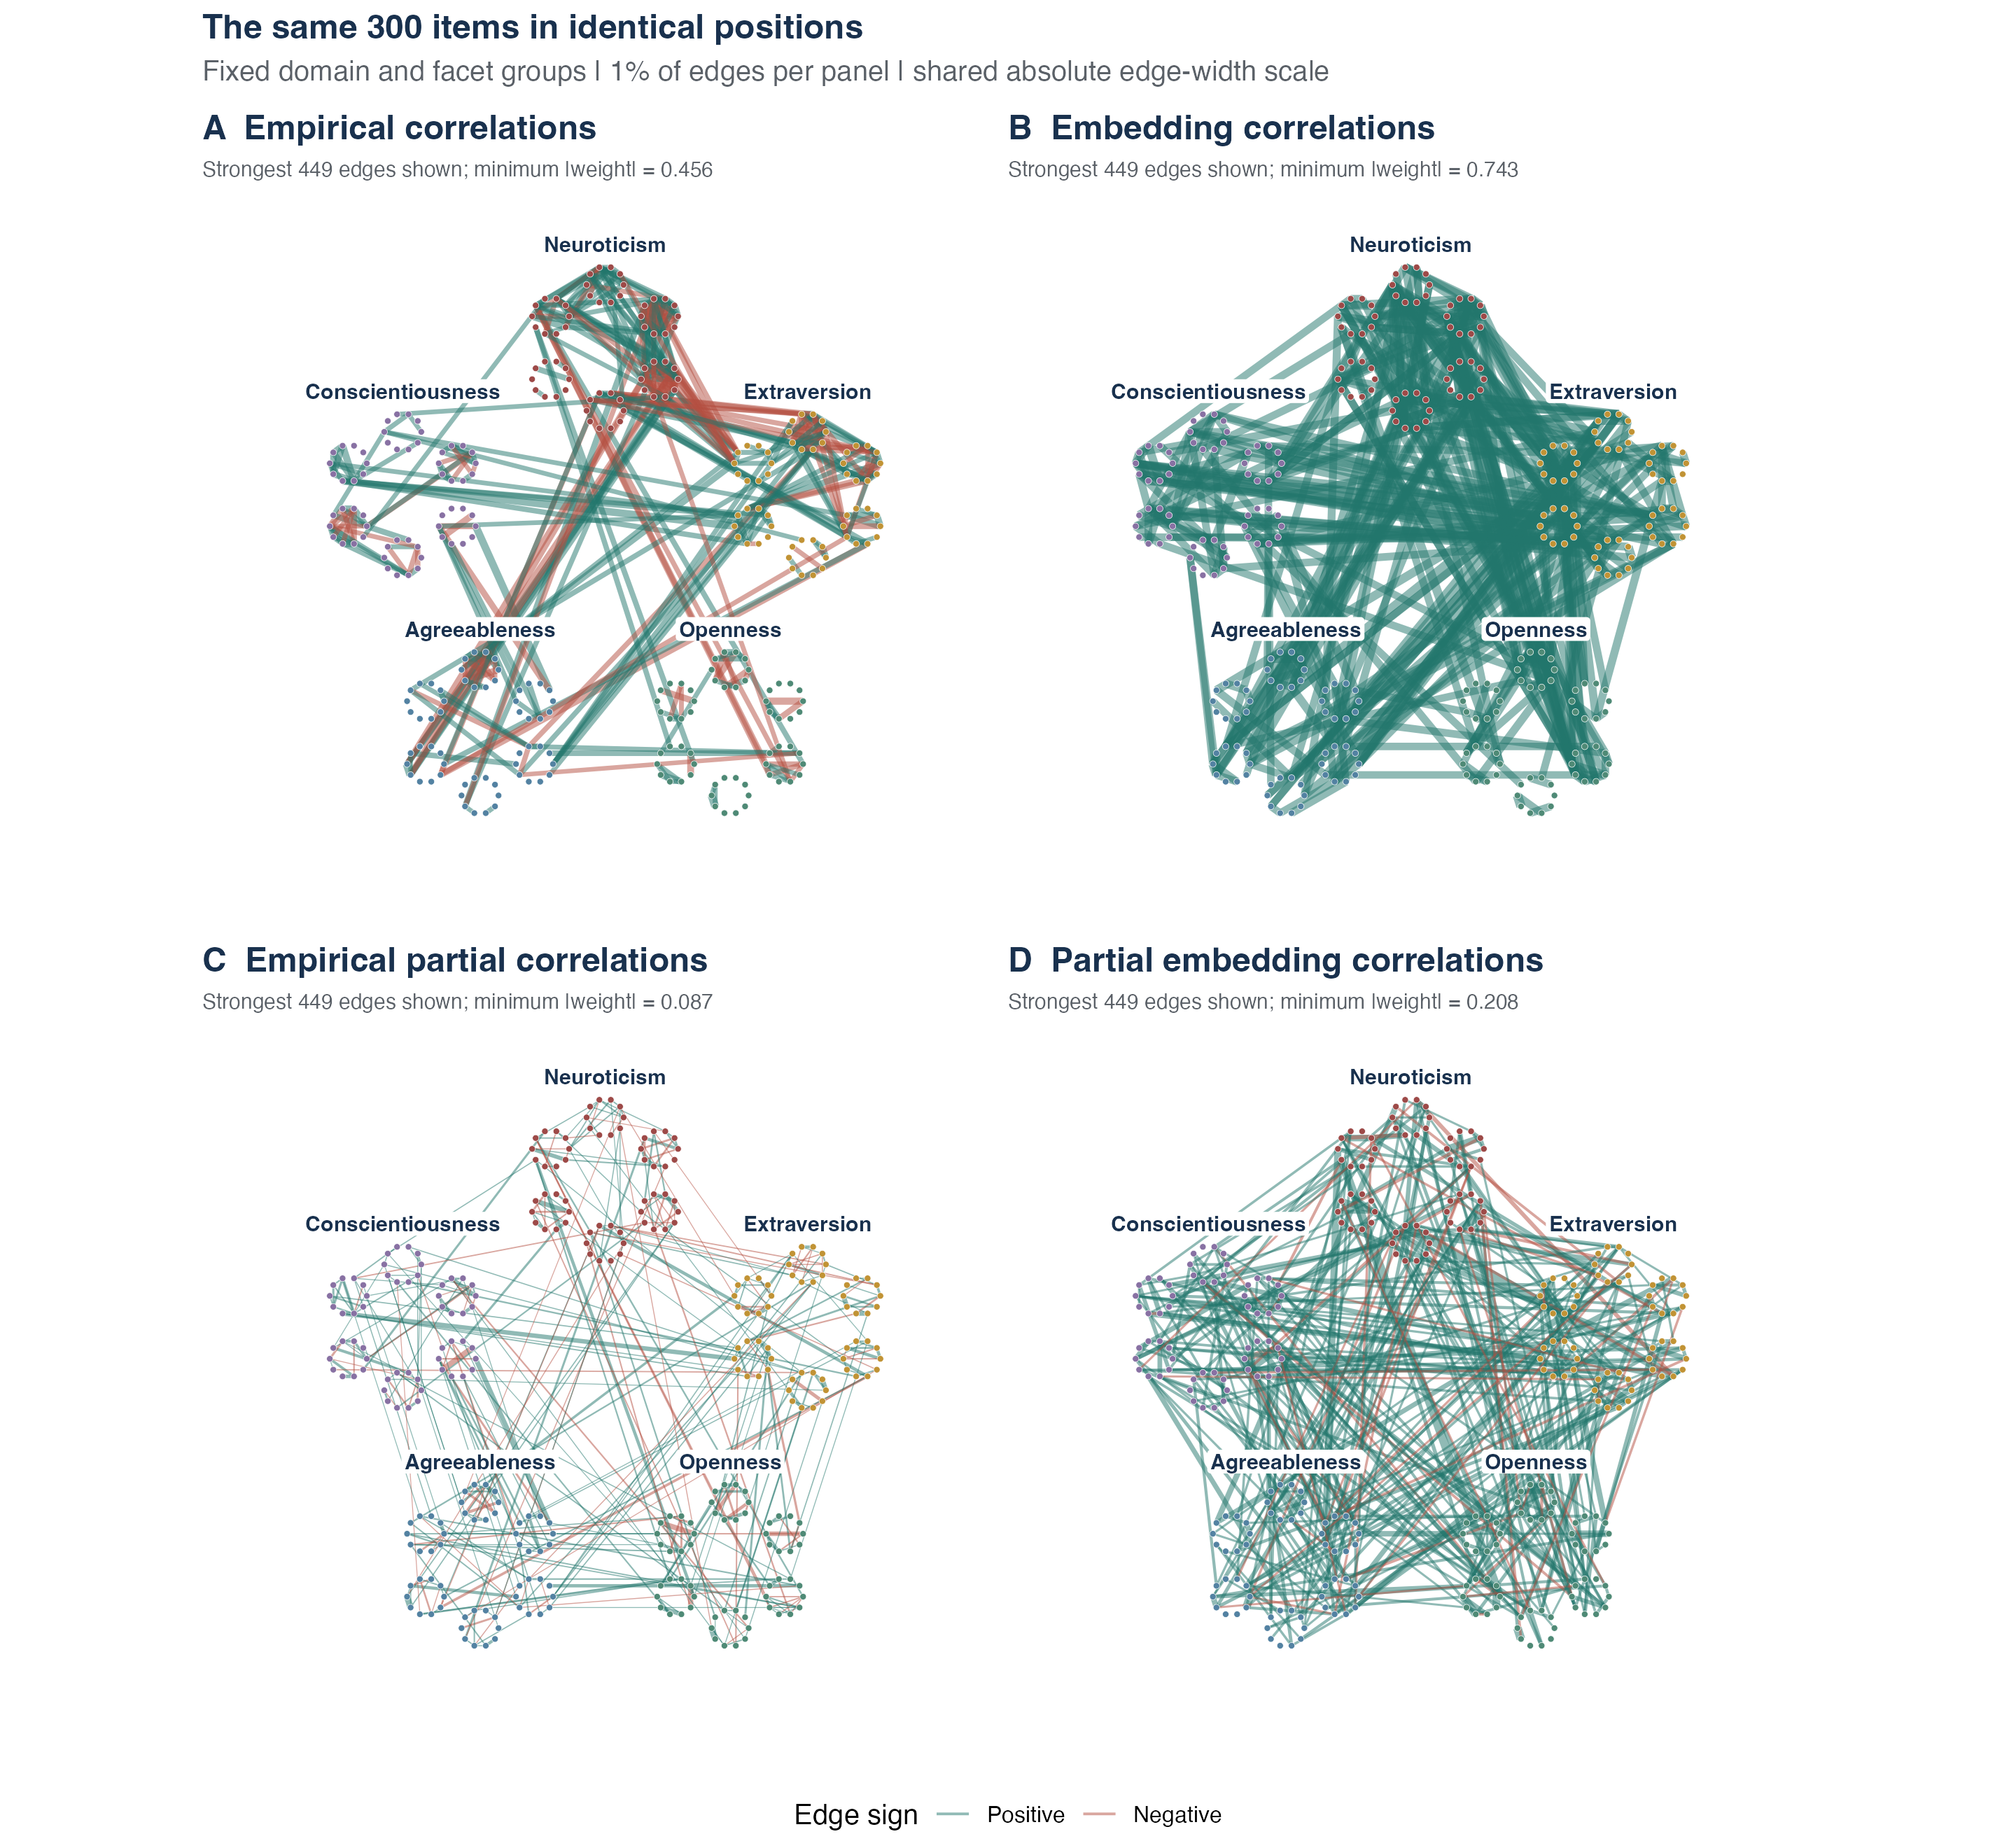
Figure 3: Four networks with identical positions for the same 300 items. Each circle is an item; colors and nearby labels identify its personality domain. Items are grouped by domain and facet according to the questionnaire key. Green connections have positive weights and terracotta connections negative weights. Line widths use the same numerical scale in all panels. Each panel shows its 449 strongest absolute connections.
For the matched partial comparison, mean resampled strength agreement was 0.319, below the observed 0.343. The signed comparison also showed a downward shift, with a bootstrap mean of 0.098 versus the observed 0.109. This limits interpretation of the resampling ranges. Both matched signed-comparison QAP tests yielded \( p < .001 \); these tests do not assess the exploratory magnitude comparisons, sign groups, or fitted curves.
After removing average differences associated with facet combinations and scoring directions, signed agreement was 0.148 for the matched zero-order comparison and 0.076 for the matched partial comparison. Rank-based empirical networks, pairwise respondent inclusion, and alternative numerical specifications are reported in the reproducibility archive. All 70 numerical and source-verification checks passed.
Discussion
The findings suggest that semantic similarity corresponds to part of the association structure among these personality items. This conclusion is conditional on the operationalization: the numerical evidence concerns correlations between representations produced by one language model. It does not directly establish how similar respondents consider the items to be. Semantic similarity and the measure used here should therefore remain distinct, just as a psychological construct remains distinct from a questionnaire score intended to measure it.
The distinction between association strength and direction is central. Items can share subject matter while describing opposing states, so semantic similarity need not imply a positive empirical correlation. Considering absolute correlations makes both directions visible. The partial comparison also shows why linear and rank agreement should be distinguished: correspondence among some larger associations can coexist with little agreement in the overall ordering of pairs.
Shared meaning and regularities in personality
Several explanations fit the correspondence. Semantically similar descriptions may refer to behaviors with shared causes. Respondents may use conceptual relationships to organize judgments about themselves. Instrument construction may retain items because they are both conceptually coherent and empirically related; the IPIP development process combined such considerations (Johnson, 2014). A language model may learn behavioral regularities alongside conventions for describing personality. These explanations can operate together.
The historical debate therefore remains open. Shweder and D'Andrade's account allows conceptual relationships to contribute to personality ratings. Romer and Revelle's critique explains why that contribution does not rule out real behavioral regularities. The present study offers a reproducible methodology for studying semantic similarity alongside response patterns. Independent behavioral observations and interventions on wording or response conditions would be needed to distinguish the causal explanations.
The question also connects to linguistic relativity, often associated with the Sapir–Whorf hypothesis: the possibility that language influences thought or perception (Winawer et al., 2007). For personality measurement, one can ask whether changing a description changes judgments while its intended content is held as constant as possible. Studies across languages, experimentally varied paraphrases, and observations of behavior as it occurs could help separate effects of language on judgments from regularities that language describes. The present observational comparison cannot establish that direction of influence.
Limits of the operationalization and sample
Semantic similarity includes several possible relations, such as shared topic, paraphrase, and opposition. A single numerical measure may weight these differently from human judges. Removing information shared with the remaining items also changes the question: the residual relation depends on this particular questionnaire. It should not be interpreted as a context-free measure of semantic similarity or as a direct measure of the causes of personality.
Only one embedding model was used, and the available computational resources limited the choice to a relatively small model. Future research should examine whether the observed correspondence between semantic similarity and empirical correlations generalizes to larger embedding models. We also used only one local model build, input prefix, and language. The public questionnaire may have appeared in the model's training data. Saving the vectors makes the calculation reproducible, but does not distinguish general knowledge of language from prior exposure to the inventory or personality literature. Further studies should compare the operational measure with explicit human judgments of semantic similarity and use additional instruments, models, paraphrases, and independent behavioral criteria.
The respondents were volunteers in a historical online study, and requiring complete records excluded most deposited records. Pairwise analyses do not correct selection bias or reconstruct the source study's screening history. Pearson and rank correlations also leave the ordinal response categories only partly addressed. Partial correlations depend on the items controlled for. Resampling conditions on the selected items and model; its downward shift for partial comparisons limits confidence-interval interpretation. Item-label permutations do not make the questionnaire a random sample of personality content. Finally, the magnitude comparisons, sign separation, and curved fits are exploratory and require replication.
Conclusion
Text embeddings provide a reproducible operationalization for investigating semantic similarity between personality items. In this application, the operational measure corresponds to empirical association strength in both positive and negative directions. Matching zero-order and partial measures reveals correspondence at both levels, with little rank agreement in the partial comparison. These results motivate further study of semantic similarity in personality measurement while leaving open how much of the correspondence reflects behavioral regularities, language-informed judgments, or their interaction.
Open Practices and Author Declarations
Status and preregistration. This is an exploratory study. The initial analysis design was recorded locally before inspecting agreement between embedding and empirical correlations; it was not publicly preregistered. Magnitude comparisons, sign separation, and bounded quadratic fits were developed after inspecting the associations.
Data and code. Public source data and item keys are available from Johnson's OSF repository (Johnson, n.d.); IPIP item content is public domain (International Personality Item Pool, n.d.). The reproducibility archive is publicly available at https://github.com/DennyBorsboom/ipip-neo-300-embeddings-reproducibility. It includes source records, saved embeddings, anonymous item responses, R scripts, all bootstrap estimates, numerical results, and figures. Appendix A identifies the version used for this paper. Source materials retain their original terms.
Contributions and AI. AI co-author OpenAI Codex (GPT-6) retrieved the materials, implemented and checked the analyses, generated figures, and drafted the paper. Prompter Denny Borsboom formulated the research question and specified the instrument, bootnet, comparable network layouts, and the distinction between semantic similarity and its operationalization. Denny Borsboom retains responsibility for the scholarly claims in this paper.
Funding and competing interests. No funding or competing-interest statement was supplied for this manuscript.
References
- Akram, M. K., Sturua, S., Havriushenko, N., Herreros, Q., Günther, M., Werk, M., & Xiao, H. (2026). jina-embeddings-v5-text: Task-targeted embedding distillation. https://arxiv.org/abs/2602.15547
- Epskamp, S., Borsboom, D., & Fried, E. I. (2018). Estimating psychological networks and their accuracy: A tutorial paper. Behavior Research Methods, 50, 195–212. https://doi.org/10.3758/s13428-017-0862-1
- Hubert, L. (1976). Quadratic assignment as a general data analysis strategy. British Journal of Mathematical and Statistical Psychology, 29(2), 190–241. https://doi.org/10.1111/j.2044-8317.1976.tb00714.x
- International Personality Item Pool. (n.d.). The items in each of the preliminary IPIP scales measuring constructs similar to the 30 NEO-PI-R facets. Retrieved https://ipip.ori.org/newNEOFacetsKey.htm
- Johnson, J. A. (n.d.). IPIP-NEO data repository: 2005 data and scoring keys. Retrieved https://osf.io/tbmh5/
- Johnson, J. A. (2005). Ascertaining the validity of individual protocols from web-based personality inventories. Journal of Research in Personality, 39(1), 103–129. https://doi.org/10.1016/j.jrp.2004.09.009
- Johnson, J. A. (2014). Measuring thirty facets of the five factor model with a 120-item public domain inventory: Development of the IPIP-NEO-120. Journal of Research in Personality, 51, 78–89. https://doi.org/10.1016/j.jrp.2014.05.003
- Markus, K. A., & Borsboom, D. (2013). Frontiers of test validity theory: Measurement, causation, and meaning. Routledge. https://dare.uva.nl/id/56b9825f-0348-46b0-af80-5b15a4f2afe0
- Messick, S. (1989). Validity. In R. L. Linn (Ed.), Educational measurement (3rd ed., pp. 13–103). American Council on Education; Macmillan. https://www.ets.org/research/policy_research_reports/publications/chapter/1989/hwrq.html
- Messick, S. (1995). Validity of psychological assessment: Validation of inferences from persons' responses and performances as scientific inquiry into score meaning. American Psychologist, 50(9), 741–749. https://doi.org/10.1037/0003-066X.50.9.741
- Romer, D., & Revelle, W. (1984). Personality traits: Fact or fiction? A critique of the Shweder and D'Andrade systematic distortion hypothesis. Journal of Personality and Social Psychology, 47(5), 1028–1042. https://doi.org/10.1037/0022-3514.47.5.1028
- Shweder, R. A., & D'Andrade, R. G. (1980). The systematic distortion hypothesis. In R. A. Shweder (Ed.), Fallible judgment in behavioral research: New directions for methodology of social and behavioral science (Vol. 4, pp. 37–58). Jossey-Bass. https://www.analytictech.com/mb870/Readings/systematicdistortion.pdf
- Winawer, J., Witthoft, N., Frank, M. C., Wu, L., Wade, A. R., & Boroditsky, L. (2007). Russian blues reveal effects of language on color discrimination. Proceedings of the National Academy of Sciences, 104(19), 7780–7785. https://doi.org/10.1073/pnas.0701644104
Appendix A. Computational details and supplementary comparisons
Zero-order and partial matrices
The empirical networks use bootnet::estimateNetwork with default="cor" and default="pcor", Pearson correlations, listwise deletion, and no thresholding. Let \( R \) denote the empirical correlation matrix. Its inverse, \( \Omega = R^{-1} \), gives the partial correlation between items \( i \) and \( j \) as
$$ P_{ij} = -\frac{\Omega_{ij}}{\sqrt{\Omega_{ii}\Omega_{jj}}}. $$
This is the correlation between residual responses after predicting each item from the other 298. No polychoric networks were fitted.
For item embedding \( e_i \), define \( u_i = e_i/\|e_i\| \). Collecting these row vectors in \( U \) gives the zero-order embedding correlation matrix \( S = UU^\top \), a Gram matrix with diagonal entries one. Its entries \( S_{ij} = u_i^\top u_j \) are uncentered correlations, or cosines. When \( S \) is invertible, the partial embedding correlations are
$$ Q_{ij} = -\frac{(S^{-1})_{ij}}{\sqrt{(S^{-1})_{ii}(S^{-1})_{jj}}}. $$
These equal the cosines between residual vectors after projecting both item vectors away from the remaining 298. Both matrices were computed through bootnet's custom-estimator interface; independent residual projections verified the equivalence. The coordinate count is not an inferential sample size.
The observed \( S \) was full rank, with minimum eigenvalue 0.00398 and condition number 41,674. The latter indicates potential sensitivity of the inverse to changes in the matrix. No numerical repair was needed. Sensitivity analyses apply the same inverse formula to \( (1 - \lambda)S + \lambda I \) for \( \lambda = .01, .05, .10 \). This ridge adjustment stabilizes the inverse while changing the quantity analyzed. Another sensitivity subtracts each embedding vector's coordinate mean before computing cosines. That centering depends on the coordinate system; the main cosine and residual-vector calculations are invariant to a common rotation. Results are in specifications.csv.
Bounded quadratic curves
For Figure 1, let \( x = S_{ij} \) and \( y = |R_{ij}| \) in the zero-order panel, and \( x = |Q_{ij}| \) and \( y = |P_{ij}| \) in the partial panel. The fitted mean is
$$ \mu(x) = \frac{1}{1 + \exp\{-(\beta_0 + \beta_1 x + \beta_2 x^2)\}}. $$
We estimate the coefficients using R's glm(y ~ x + I(x^2), family = quasibinomial(link = "logit")). This fits a quadratic on the logit scale for a fractional response, keeping its fitted mean between 0 and 1. Each observed pair has equal weight. Figure 2 repeats this fit separately for positive and negative empirical pairs and plots \( -\mu(x) \) for the negative group. Curves are drawn only within each group's observed predictor range. Their coefficients and prediction grids are saved in display_curve_parameters.csv and display_curve_predictions.csv. The form was selected to accommodate curvature and the response bounds; it was not selected by an inferential test. Model standard errors, significance tests, and independent-pair confidence bands are not used.
Permutation comparisons and facet adjustment
QAP shuffles item labels jointly across rows and columns of the embedding matrix (Hubert, 1976). We used 4,999 unrestricted permutations and two-sided tests for signed agreement. The p-value counts permutation statistics at least as extreme in absolute value as the observed statistic, adding one to both the count and the number of permutations.
For facet adjustment, we grouped pairs by their combination of facets and whether their scoring directions matched. We subtracted each group's mean separately from its empirical and embedding correlations and correlated the resulting deviations. A restricted QAP shuffled items within their facet and scoring direction, using another 4,999 permutations. Results are in adjusted.csv.
Reproducing the analysis
Download version 1.0.0 of the reproducibility archive from https://github.com/DennyBorsboom/ipip-neo-300-embeddings-reproducibility/releases/tag/v1.0.0 and extract the attached ZIP file. This release preserves the inputs, code, and results used in this paper.
Run Rscript run_all.R from the reproducibility archive to import inputs, estimate networks, reuse included bootstrap checkpoints, calculate comparisons, generate figures, and validate results. Use --serial if parallel workers are unavailable. To draw fresh bootstrap samples, first move the saved bootstrap_*.rds checkpoints out of results/raw. Rscript run_all.R --verify independently checks frozen matrices, correlations, residual projections, wording and keys, bootstrap counts, fitted curves, and shared network positions. Software versions are recorded in session-info.
The package contains 500 zero-order and 500 partial-correlation bootstrap networks. Respondent-resampling seeds are 72901 plus each checkpoint's starting replicate index; permutation seeds are 72902 and 72903. The main summaries are in results/headline_results.csv. Additional tables include signed and magnitude correlations for all four measure combinations, sign-group summaries, numerical sensitivities, and bootstrap diagnostics. Percentile columns are descriptive resampling ranges, not calibrated confidence limits for agreement across pairs.
analysis/05_figures.R generates the figures. network_layout.csv saves the shared coordinates, and network_display_edges.csv records each displayed connection. Full matrices and the 44,850-row edges.csv retain all connections, including those omitted from the network pictures.
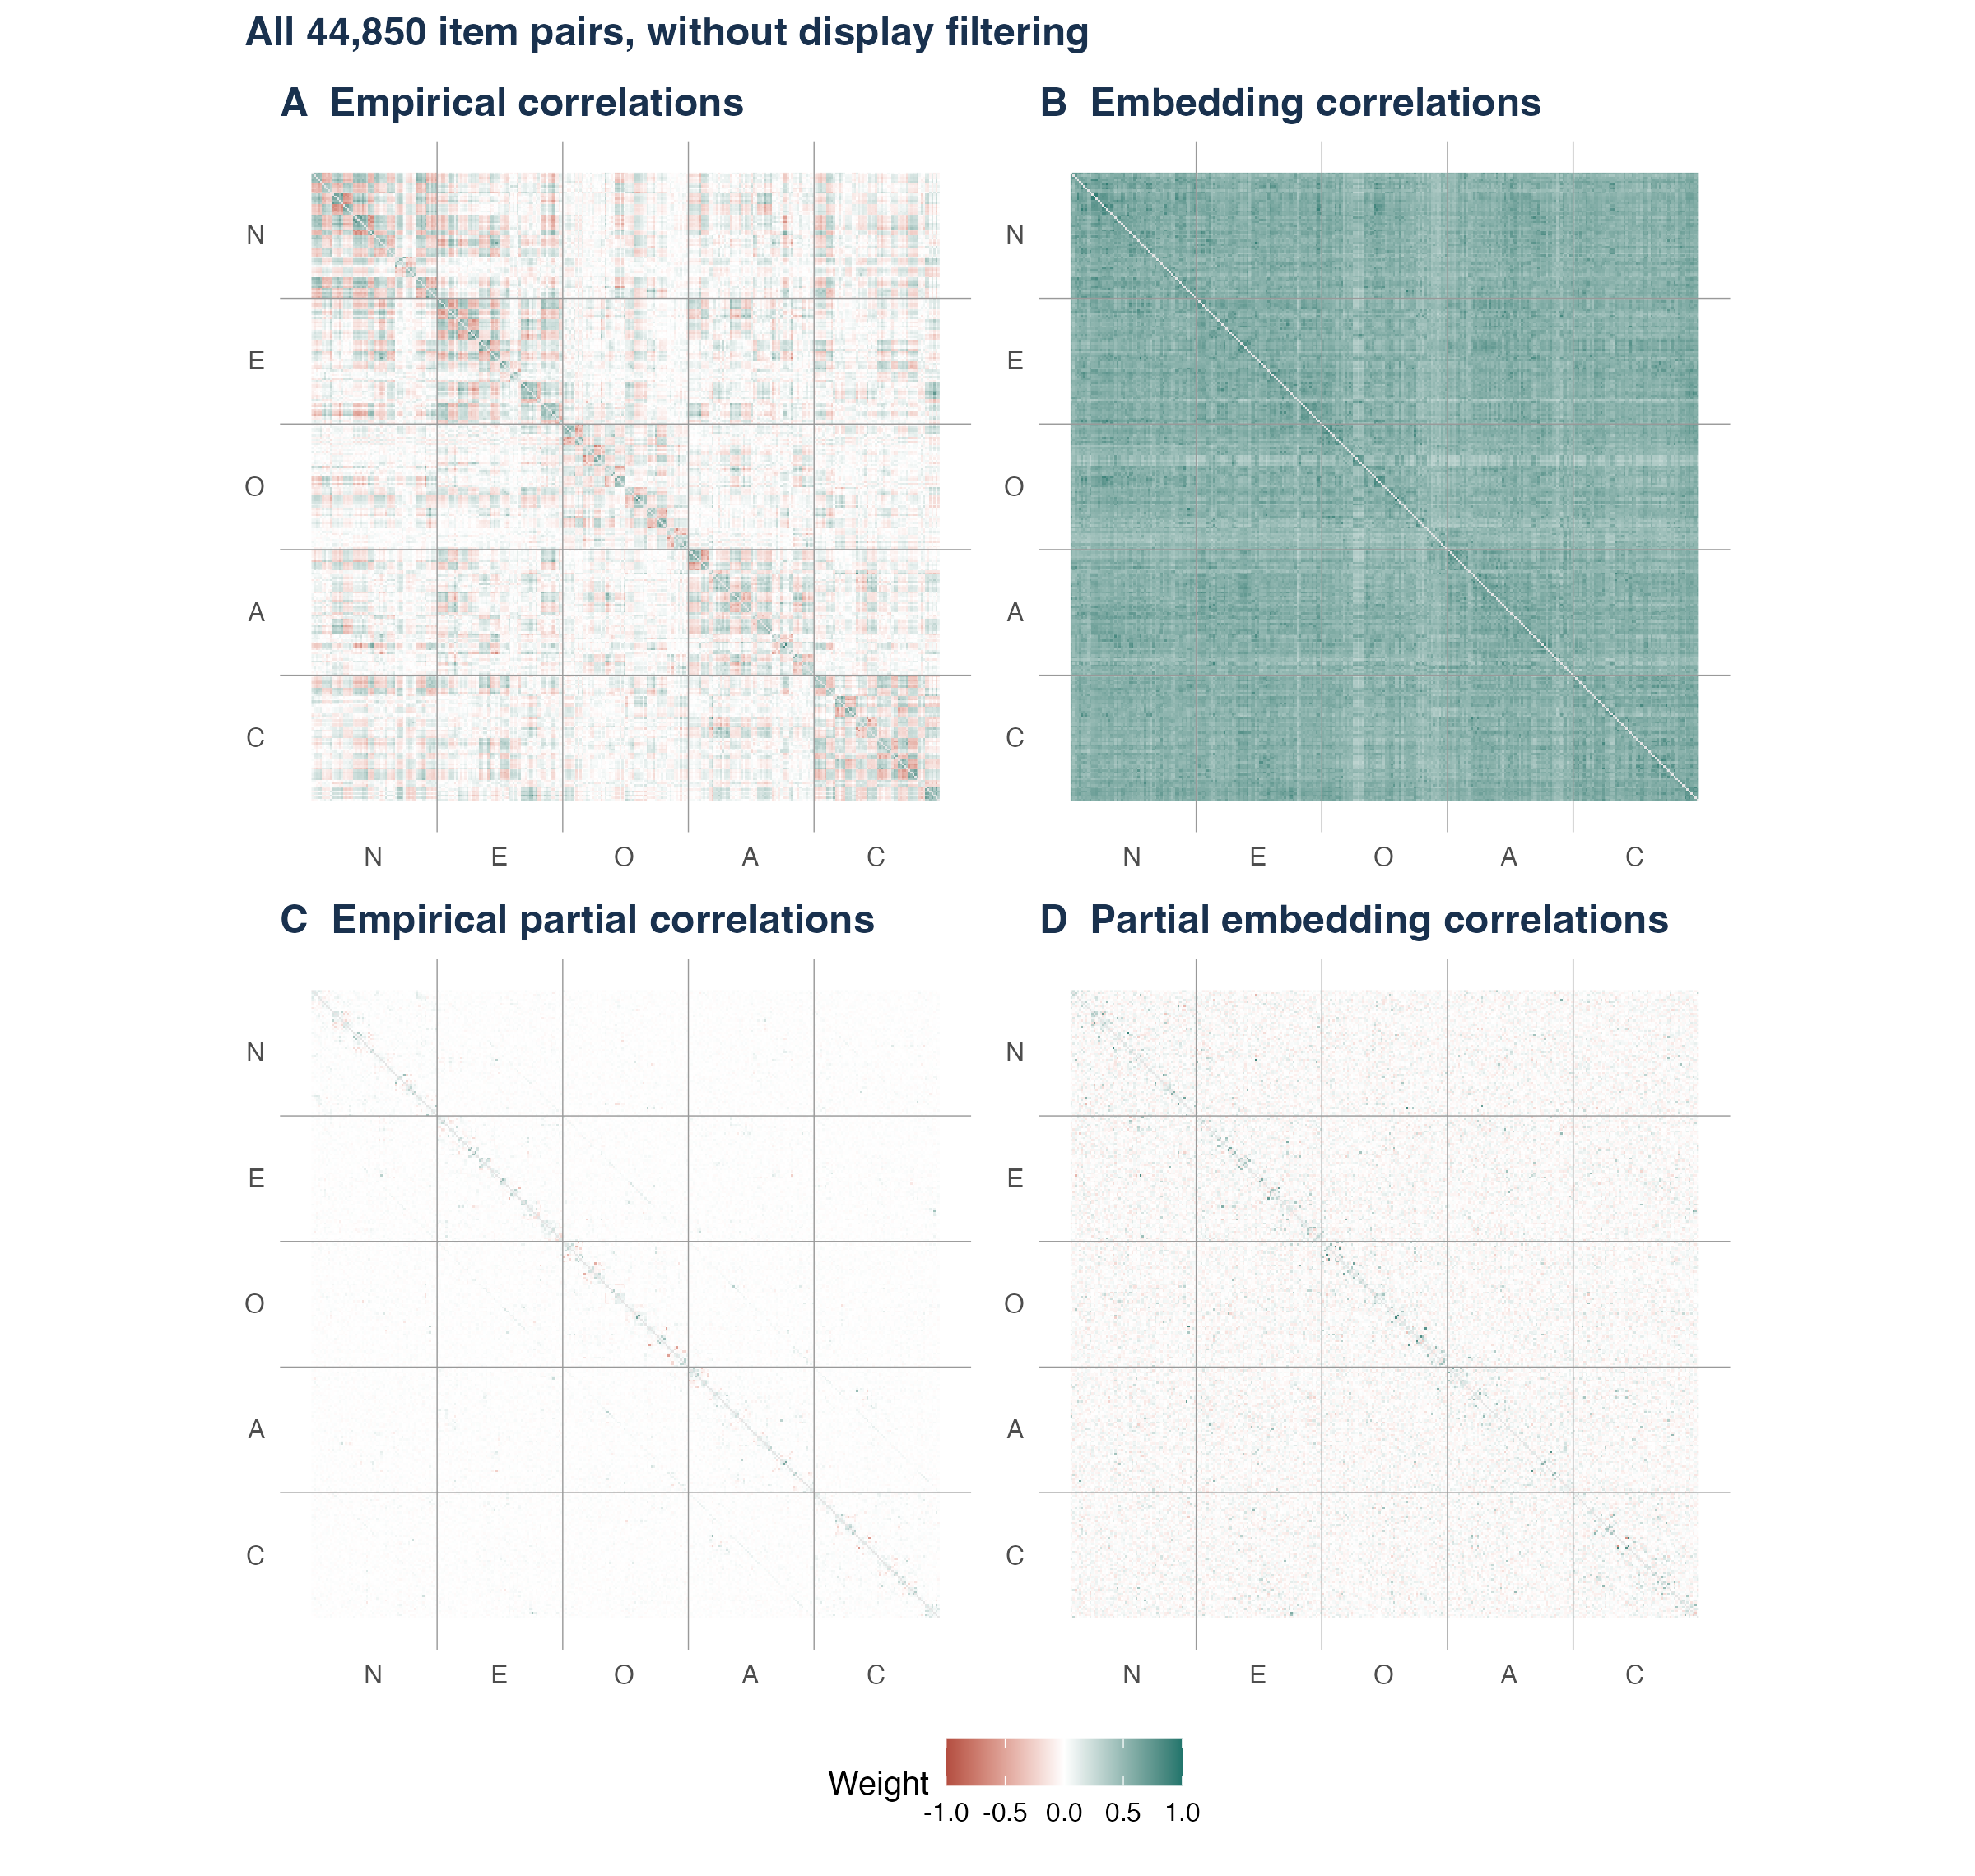
Figure 4: Complete matrices of empirical and embedding correlations. Item ordering is identical in every panel, grouped by domain and facet: N = Neuroticism, E = Extraversion, O = Openness, A = Agreeableness, C = Conscientiousness. Each cell represents an item pair, with a common color scale from -1 to 1. Diagonal entries are hidden. Both triangles are shown, so each distinct pair appears twice.
Appendix B. Exact item wording
The text below is the scoring-key wording. The embedding input adds only Document: before each statement. Item numbers refer to the 300-item form. A plus or minus indicates the facet scoring direction; empirical correlations use responses indicating agreement with each displayed statement. Facet codes combine a domain letter with a facet number from 1 to 6. N = Neuroticism; E = Extraversion; O = Openness; A = Agreeableness; C = Conscientiousness.
| No. | Facet | Key | Exact item wording |
|---|---|---|---|
| 1 | N1 | + | Worry about things. |
| 2 | E1 | + | Make friends easily. |
| 3 | O1 | + | Have a vivid imagination. |
| 4 | A1 | + | Trust others. |
| 5 | C1 | + | Complete tasks successfully. |
| 6 | N2 | + | Get angry easily. |
| 7 | E2 | + | Love large parties. |
| 8 | O2 | + | Believe in the importance of art. |
| 9 | A2 | + | Would never cheat on my taxes. |
| 10 | C2 | + | Like order. |
| 11 | N3 | + | Often feel blue. |
| 12 | E3 | + | Take charge. |
| 13 | O3 | + | Experience my emotions intensely. |
| 14 | A3 | + | Make people feel welcome. |
| 15 | C3 | + | Try to follow the rules. |
| 16 | N4 | + | Am easily intimidated. |
| 17 | E4 | + | Am always busy. |
| 18 | O4 | + | Prefer variety to routine. |
| 19 | A4 | + | Am easy to satisfy. |
| 20 | C4 | + | Go straight for the goal. |
| 21 | N5 | + | Often eat too much. |
| 22 | E5 | + | Love excitement. |
| 23 | O5 | + | Like to solve complex problems. |
| 24 | A5 | + | Dislike being the center of attention. |
| 25 | C5 | + | Get chores done right away. |
| 26 | N6 | + | Panic easily. |
| 27 | E6 | + | Radiate joy. |
| 28 | O6 | + | Tend to vote for liberal political candidates. |
| 29 | A6 | + | Sympathize with the homeless. |
| 30 | C6 | + | Avoid mistakes. |
| 31 | N1 | + | Fear for the worst. |
| 32 | E1 | + | Warm up quickly to others. |
| 33 | O1 | + | Enjoy wild flights of fantasy. |
| 34 | A1 | + | Believe that others have good intentions. |
| 35 | C1 | + | Excel in what I do. |
| 36 | N2 | + | Get irritated easily. |
| 37 | E2 | + | Talk to a lot of different people at parties. |
| 38 | O2 | + | Like music. |
| 39 | A2 | + | Stick to the rules. |
| 40 | C2 | + | Like to tidy up. |
| 41 | N3 | + | Dislike myself. |
| 42 | E3 | + | Try to lead others. |
| 43 | O3 | + | Feel others' emotions. |
| 44 | A3 | + | Anticipate the needs of others. |
| 45 | C3 | + | Keep my promises. |
| 46 | N4 | + | Am afraid that I will do the wrong thing. |
| 47 | E4 | + | Am always on the go. |
| 48 | O4 | + | Like to visit new places. |
| 49 | A4 | + | Can't stand confrontations. |
| 50 | C4 | + | Work hard. |
| 51 | N5 | + | Don't know why I do some of the things I do. |
| 52 | E5 | + | Seek adventure. |
| 53 | O5 | + | Love to read challenging material. |
| 54 | A5 | + | Dislike talking about myself. |
| 55 | C5 | + | Am always prepared. |
| 56 | N6 | + | Become overwhelmed by events. |
| 57 | E6 | + | Have a lot of fun. |
| 58 | O6 | + | Believe that there is no absolute right or wrong. |
| 59 | A6 | + | Feel sympathy for those who are worse off than myself. |
| 60 | C6 | + | Choose my words with care. |
| 61 | N1 | + | Am afraid of many things. |
| 62 | E1 | + | Feel comfortable around people. |
| 63 | O1 | + | Love to daydream. |
| 64 | A1 | + | Trust what people say. |
| 65 | C1 | + | Handle tasks smoothly. |
| 66 | N2 | + | Get upset easily. |
| 67 | E2 | + | Enjoy being part of a group. |
| 68 | O2 | + | See beauty in things that others might not notice. |
| 69 | A2 | - | Use flattery to get ahead. |
| 70 | C2 | + | Want everything to be "just right." |
| 71 | N3 | + | Am often down in the dumps. |
| 72 | E3 | + | Can talk others into doing things. |
| 73 | O3 | + | Am passionate about causes. |
| 74 | A3 | + | Love to help others. |
| 75 | C3 | + | Pay my bills on time. |
| 76 | N4 | + | Find it difficult to approach others. |
| 77 | E4 | + | Do a lot in my spare time. |
| 78 | O4 | + | Interested in many things. |
| 79 | A4 | + | Hate to seem pushy. |
| 80 | C4 | + | Turn plans into actions. |
| 81 | N5 | + | Do things I later regret. |
| 82 | E5 | + | Love action. |
| 83 | O5 | + | Have a rich vocabulary. |
| 84 | A5 | + | Consider myself an average person. |
| 85 | C5 | + | Start tasks right away. |
| 86 | N6 | + | Feel that I'm unable to deal with things. |
| 87 | E6 | + | Express childlike joy. |
| 88 | O6 | + | Believe that criminals should receive help rather than punishment. |
| 89 | A6 | + | Value cooperation over competition. |
| 90 | C6 | + | Stick to my chosen path. |
| 91 | N1 | + | Get stressed out easily. |
| 92 | E1 | + | Act comfortably with others. |
| 93 | O1 | + | Like to get lost in thought. |
| 94 | A1 | + | Believe that people are basically moral. |
| 95 | C1 | + | Am sure of my ground. |
| 96 | N2 | + | Am often in a bad mood. |
| 97 | E2 | + | Involve others in what I am doing. |
| 98 | O2 | + | Love flowers. |
| 99 | A2 | - | Use others for my own ends. |
| 100 | C2 | + | Love order and regularity. |
| 101 | N3 | + | Have a low opinion of myself. |
| 102 | E3 | + | Seek to influence others. |
| 103 | O3 | + | Enjoy examining myself and my life. |
| 104 | A3 | + | Am concerned about others. |
| 105 | C3 | + | Tell the truth. |
| 106 | N4 | + | Am afraid to draw attention to myself. |
| 107 | E4 | + | Can manage many things at the same time. |
| 108 | O4 | + | Like to begin new things. |
| 109 | A4 | - | Have a sharp tongue. |
| 110 | C4 | + | Plunge into tasks with all my heart. |
| 111 | N5 | + | Go on binges. |
| 112 | E5 | + | Enjoy being part of a loud crowd. |
| 113 | O5 | + | Can handle a lot of information. |
| 114 | A5 | + | Seldom toot my own horn. |
| 115 | C5 | + | Get to work at once. |
| 116 | N6 | + | Can't make up my mind. |
| 117 | E6 | + | Laugh my way through life. |
| 118 | O6 | - | Believe in one true religion. |
| 119 | A6 | + | Suffer from others' sorrows. |
| 120 | C6 | - | Jump into things without thinking. |
| 121 | N1 | + | Get caught up in my problems. |
| 122 | E1 | + | Cheer people up. |
| 123 | O1 | + | Indulge in my fantasies. |
| 124 | A1 | + | Believe in human goodness. |
| 125 | C1 | + | Come up with good solutions. |
| 126 | N2 | + | Lose my temper. |
| 127 | E2 | + | Love surprise parties. |
| 128 | O2 | + | Enjoy the beauty of nature. |
| 129 | A2 | - | Know how to get around the rules. |
| 130 | C2 | + | Do things according to a plan. |
| 131 | N3 | + | Have frequent mood swings. |
| 132 | E3 | + | Take control of things. |
| 133 | O3 | + | Try to understand myself. |
| 134 | A3 | + | Have a good word for everyone. |
| 135 | C3 | + | Listen to my conscience. |
| 136 | N4 | + | Only feel comfortable with friends. |
| 137 | E4 | + | React quickly. |
| 138 | O4 | - | Prefer to stick with things that I know. |
| 139 | A4 | - | Contradict others. |
| 140 | C4 | + | Do more than what's expected of me. |
| 141 | N5 | + | Love to eat. |
| 142 | E5 | + | Enjoy being reckless. |
| 143 | O5 | + | Enjoy thinking about things. |
| 144 | A5 | - | Believe that I am better than others. |
| 145 | C5 | + | Carry out my plans. |
| 146 | N6 | + | Get overwhelmed by emotions. |
| 147 | E6 | + | Love life. |
| 148 | O6 | - | Tend to vote for conservative political candidates. |
| 149 | A6 | - | Am not interested in other people's problems. |
| 150 | C6 | - | Make rash decisions. |
| 151 | N1 | - | Am not easily bothered by things. |
| 152 | E1 | - | Am hard to get to know. |
| 153 | O1 | + | Spend time reflecting on things. |
| 154 | A1 | + | Think that all will be well. |
| 155 | C1 | + | Know how to get things done. |
| 156 | N2 | - | Rarely get irritated. |
| 157 | E2 | - | Prefer to be alone. |
| 158 | O2 | - | Do not like art. |
| 159 | A2 | - | Cheat to get ahead. |
| 160 | C2 | - | Often forget to put things back in their proper place. |
| 161 | N3 | + | Feel desperate. |
| 162 | E3 | - | Wait for others to lead the way. |
| 163 | O3 | - | Seldom get emotional. |
| 164 | A3 | - | Look down on others. |
| 165 | C3 | - | Break rules. |
| 166 | N4 | + | Stumble over my words. |
| 167 | E4 | - | Like to take it easy. |
| 168 | O4 | - | Dislike changes. |
| 169 | A4 | - | Love a good fight. |
| 170 | C4 | + | Set high standards for myself and others. |
| 171 | N5 | - | Rarely overindulge. |
| 172 | E5 | + | Act wild and crazy. |
| 173 | O5 | - | Am not interested in abstract ideas. |
| 174 | A5 | - | Think highly of myself. |
| 175 | C5 | - | Find it difficult to get down to work. |
| 176 | N6 | - | Remain calm under pressure. |
| 177 | E6 | + | Look at the bright side of life. |
| 178 | O6 | - | Believe that too much tax money goes to support artists. |
| 179 | A6 | - | Tend to dislike soft-hearted people. |
| 180 | C6 | - | Like to act on a whim. |
| 181 | N1 | - | Am relaxed most of the time. |
| 182 | E1 | - | Often feel uncomfortable around others. |
| 183 | O1 | - | Seldom daydream. |
| 184 | A1 | - | Distrust people. |
| 185 | C1 | - | Misjudge situations. |
| 186 | N2 | - | Seldom get mad. |
| 187 | E2 | - | Want to be left alone. |
| 188 | O2 | - | Do not like poetry. |
| 189 | A2 | - | Put people under pressure. |
| 190 | C2 | - | Leave a mess in my room. |
| 191 | N3 | + | Feel that my life lacks direction. |
| 192 | E3 | - | Keep in the background. |
| 193 | O3 | - | Am not easily affected by my emotions. |
| 194 | A3 | - | Am indifferent to the feelings of others. |
| 195 | C3 | - | Break my promises. |
| 196 | N4 | - | Am not embarrassed easily. |
| 197 | E4 | - | Like to take my time. |
| 198 | O4 | - | Don't like the idea of change. |
| 199 | A4 | - | Yell at people. |
| 200 | C4 | + | Demand quality. |
| 201 | N5 | - | Easily resist temptations. |
| 202 | E5 | + | Willing to try anything once. |
| 203 | O5 | - | Avoid philosophical discussions. |
| 204 | A5 | - | Have a high opinion of myself. |
| 205 | C5 | - | Waste my time. |
| 206 | N6 | - | Can handle complex problems. |
| 207 | E6 | + | Laugh aloud. |
| 208 | O6 | - | Believe laws should be strictly enforced. |
| 209 | A6 | - | Believe in an eye for an eye. |
| 210 | C6 | - | Rush into things. |
| 211 | N1 | - | Am not easily disturbed by events. |
| 212 | E1 | - | Avoid contacts with others. |
| 213 | O1 | - | Do not have a good imagination. |
| 214 | A1 | - | Suspect hidden motives in others. |
| 215 | C1 | - | Don't understand things. |
| 216 | N2 | - | Am not easily annoyed. |
| 217 | E2 | - | Don't like crowded events. |
| 218 | O2 | - | Do not enjoy going to art museums. |
| 219 | A2 | - | Pretend to be concerned for others. |
| 220 | C2 | - | Leave my belongings around. |
| 221 | N3 | - | Seldom feel blue. |
| 222 | E3 | - | Have little to say. |
| 223 | O3 | - | Rarely notice my emotional reactions. |
| 224 | A3 | - | Make people feel uncomfortable. |
| 225 | C3 | - | Get others to do my duties. |
| 226 | N4 | - | Am comfortable in unfamiliar situations. |
| 227 | E4 | - | Like a leisurely lifestyle. |
| 228 | O4 | - | Am a creature of habit. |
| 229 | A4 | - | Insult people. |
| 230 | C4 | - | Am not highly motivated to succeed. |
| 231 | N5 | - | Am able to control my cravings. |
| 232 | E5 | + | Seek danger. |
| 233 | O5 | - | Have difficulty understanding abstract ideas. |
| 234 | A5 | - | Know the answers to many questions. |
| 235 | C5 | - | Need a push to get started. |
| 236 | N6 | - | Know how to cope. |
| 237 | E6 | + | Amuse my friends. |
| 238 | O6 | - | Believe that we coddle criminals too much. |
| 239 | A6 | - | Try not to think about the needy. |
| 240 | C6 | - | Do crazy things. |
| 241 | N1 | - | Don't worry about things that have already happened. |
| 242 | E1 | - | Am not really interested in others. |
| 243 | O1 | - | Seldom get lost in thought. |
| 244 | A1 | - | Am wary of others. |
| 245 | C1 | - | Have little to contribute. |
| 246 | N2 | - | Keep my cool. |
| 247 | E2 | - | Avoid crowds. |
| 248 | O2 | - | Do not like concerts. |
| 249 | A2 | - | Take advantage of others. |
| 250 | C2 | - | Am not bothered by messy people. |
| 251 | N3 | - | Feel comfortable with myself. |
| 252 | E3 | - | Don't like to draw attention to myself. |
| 253 | O3 | - | Experience very few emotional highs and lows. |
| 254 | A3 | - | Turn my back on others. |
| 255 | C3 | - | Do the opposite of what is asked. |
| 256 | N4 | - | Am not bothered by difficult social situations. |
| 257 | E4 | - | Let things proceed at their own pace. |
| 258 | O4 | - | Dislike new foods. |
| 259 | A4 | - | Get back at others. |
| 260 | C4 | - | Do just enough work to get by. |
| 261 | N5 | - | Never spend more than I can afford. |
| 262 | E5 | - | Would never go hang gliding or bungee jumping. |
| 263 | O5 | - | Am not interested in theoretical discussions. |
| 264 | A5 | - | Boast about my virtues. |
| 265 | C5 | - | Have difficulty starting tasks. |
| 266 | N6 | - | Readily overcome setbacks. |
| 267 | E6 | - | Am not easily amused. |
| 268 | O6 | - | Believe that we should be tough on crime. |
| 269 | A6 | - | Believe people should fend for themselves. |
| 270 | C6 | - | Act without thinking. |
| 271 | N1 | - | Adapt easily to new situations. |
| 272 | E1 | - | Keep others at a distance. |
| 273 | O1 | - | Have difficulty imagining things. |
| 274 | A1 | - | Believe that people are essentially evil. |
| 275 | C1 | - | Don't see the consequences of things. |
| 276 | N2 | - | Rarely complain. |
| 277 | E2 | - | Seek quiet. |
| 278 | O2 | - | Do not enjoy watching dance performances. |
| 279 | A2 | - | Obstruct others' plans. |
| 280 | C2 | - | Am not bothered by disorder. |
| 281 | N3 | - | Am very pleased with myself. |
| 282 | E3 | - | Hold back my opinions. |
| 283 | O3 | - | Don't understand people who get emotional. |
| 284 | A3 | - | Take no time for others. |
| 285 | C3 | - | Misrepresent the facts. |
| 286 | N4 | - | Am able to stand up for myself. |
| 287 | E4 | - | React slowly. |
| 288 | O4 | - | Am attached to conventional ways. |
| 289 | A4 | - | Hold a grudge. |
| 290 | C4 | - | Put little time and effort into my work. |
| 291 | N5 | - | Never splurge. |
| 292 | E5 | - | Dislike loud music. |
| 293 | O5 | - | Avoid difficult reading material. |
| 294 | A5 | - | Make myself the center of attention. |
| 295 | C5 | - | Postpone decisions. |
| 296 | N6 | - | Am calm even in tense situations. |
| 297 | E6 | - | Seldom joke around. |
| 298 | O6 | - | Like to stand during the national anthem. |
| 299 | A6 | - | Can't stand weak people. |
| 300 | C6 | - | Often make last-minute plans. |
This reading version was generated from the PDF by an AI conversion pipeline; the PDF remains the version of record.
📝 About this HTML version
This HTML document was automatically generated from the PDF. Some formatting, figures, or mathematical notation may not be perfectly preserved. For the authoritative version, please refer to the PDF.