The Toronto Urban Evolution Model (TUEM) offers a formal language for generat- ing empirical claims about urban evolution. Its basic unit is the formeme: information about how space is physically organized for particular activities and groups. This paper operationalizes a limited observable subset of TUEM through linked histori- cal evidence for U.S. census tracts and metropolitan areas, combining road-network trajectories, census and ACS resident composition, and formal-establishment activity profiles from federal business records. The analysis asks what can be learned when TUEM signatures are translated into measured physical, group, and activity traces. TUEM is treated here as a claim-generating model: the empirical task is to determine which formal terms can be represented by available proxies, which claims become descriptive regularities, which are sensitive to measurement choices, and which lose support when translated into observable tests. The paper separates four evidentiary tasks: constructing classifications, describing empirical patterns, testing measurement sensitivity, and evaluating a deliberately nar- row selection implication. The strongest findings are measurement and classification results. Road histories form recurrent terrain families, and those terrain families can be crossed with retained, activity-profile-moving, group-moving, and coupled P-G-A histories. Physical form is often durable, with durability varying by component and pathway. Activity-profile movement within low-moving road containers is recurrent, providing a bounded trace of possible recoding while leaving zoning, ownership, building reuse, and lived meaning outside the present data. Additional high-coverage, county-validation, threshold, and held-out prediction checks support using the activity layer as a formal-establishment proxy while showing modest and uneven predictive gains from bundled context. The most mechanism-like test, activity saturation selecting substitute or hybrid forms, receives little support. The contribution is a reproducible empirical translation of TUEM into observable propositions and a clearer account of where current proxy evidence can support, narrow, or reject formal model claims.
From Formal Model to Empirical Propositions
AI Author: OpenAI GPT-5 Codex
Prompter: Daniel Silver
Correspondence: dan.silver@utoronto.ca
Submitted: May 31, 2026
1. Introduction
Urban science has made major progress in describing regularities of city size, spatial structure, and network organization (Batty 2008; Bettencourt et al. 2007; Bettencourt 2013; Boeing 2019). A central open problem remains evolutionary: explaining how urban arrangements emerge, persist, are reused, and are transformed over time (Silver, Adler, and Fox 2022; Mehmood 2010; Marshall 2009; Scheer 2017). This problem cannot be solved by physical morphology alone. A road pattern can survive while users and activities change; conversely, rapid physical extension can occur with continuity in social composition or local activity (Jacobs 1969; Duranton and Puga 2001; Fischer 1975). An evolutionary account therefore needs a unit that links material form to the uses and users through which form is carried and changed.
The Toronto Urban Evolution Model (TUEM) was developed to define that unit and to provide a formal basis for empirical testing (Silver, Adler, and Fox 2022; Fox, Silver, and Adler 2022; Silver, Fox, and Adler 2022; Fox, Silver, Silva, and Zhang 2022). TUEM's core unit is the formeme: information for physically organizing space for particular activities and groups. A formeme is not a street pattern alone, a land-use class alone, or a demographic profile alone. It is a relational unit joining physical organization, activities, and groups. TUEM calls the time-stamped bundle of this information in a place its signature, and treats signatures as comparable through distance and trajectory logic (Fox, Silver, and Adler 2022; Fox, Silver, Silva, and Zhang 2022).
TUEM is a claim-generating model as well as a descriptive vocabulary. It specifies families of possible mechanisms–variation, selection, retention, recoding, and trajectory–and therefore generates claims that should be supported, narrowed, deferred, or rejected with evidence (Silver, Fox, and Adler 2022). This paper operationalizes a limited observable subset of TUEM claims in a single linked dataset, separates classification from validation and mechanism tests, and returns the resulting supported, fragile, and unsupported claims to the model, in line with broader calls for explicit model-to-evidence bridges in social theory (Stinchcombe 1987; Brown 2013).
The dataset links three evidence layers across U.S. census tracts and metropolitan areas. The physical layer is drawn from CHRONEX-US, a historical road-network expansion dataset, and linked built-maturity registers (Uhl, Burghardt, and Leyk 2025). The group layer is drawn from the Longitudinal Tract Database (LTDB), decennial census records, and the American Community Survey (ACS) (Logan, Xu, and Stults 2014). The activity layer is drawn from ZIP Code Business Patterns (ZBP) and County Business Patterns (CBP), which provide establishment and employment structure by industry (U.S. Census Bureau 2024a, 2024b). These activity data are best read as a formal-establishment proxy: they observe registered economic organizations well, but not all informal, household, visitor, institutional, or online activity.
The empirical argument proceeds through six named claims, but the claims do not carry the same evidentiary status. The first three are primarily measurement and classification claims: whether road histories can be classified as trajectories, whether physical, group, and activity components differ in relative movement, and whether expansion and recombination are empirically separable. The fourth and fifth are descriptive interpretation claims: whether similar physical terrains carry different group and activity histories, and whether stable physical containers are paired with establishment-profile or resident-composition movement. The sixth is a mechanism-like selection claim: whether activity saturation selects substitute or hybrid forms. The answer is mixed in an informative way. Trajectory classification is useful, expansion and recombination are distinguishable, and low-moving road containers are often paired with establishment-profile movement. Physical durability is real but conditional rather than universal. The same-terrain result is a descriptive classification result rather than a sorting-mechanism result. The saturation-to-substitution claim is not supported as a broad mechanism in these data.
The contribution is both substantive and methodological, but it is deliberately bounded. Substantively, the paper shows that present physical form is an incomplete label for observed urban trajectories: similar road terrains can be paired with different resident-composition and formal-establishment histories, and low-moving road containers can be associated with changing establishment profiles. Methodologically, it shows how a formal urban-evolution model can be translated into observable claims, evaluated against linked historical evidence, and narrowed when the evidence is descriptive, measurement-sensitive, or negative rather than confirmatory.
2. Background and Related Work
2.1 Urban Regularities and the Problem of Evolution
Urban science has produced strong evidence on recurrent city patterns, including scaling regularities, network effects, and built-form structure (Batty 2008; Bettencourt et al. 2007; Bettencourt 2013; Boeing 2019). Parallel work in urban complexity and self-organization has emphasized that macro-order can emerge from local interaction and path-dependent adaptation (Portugali 2000; Portugali 2012; Batty 2007). These traditions made cities comparable across places and scales, but they also sharpened a harder historical problem: how urban characteristics emerge, persist, and change function through time.
Several precursor literatures point toward that evolutionary problem but do not resolve it in a unified empirical framework. Stage and ecology traditions describe urban succession and differentiation, but often under-specify mechanisms linking material form, social groups, and activities (Silver, Adler, and Fox 2022). Urban DNA and path-dependence approaches identify durable signatures and lineage-like dynamics, but frequently treat social and functional recoding indirectly or at coarser abstraction (Wilson 2008; Delmelle 2016; Sorensen 2015). Planning-oriented evolutionary metaphors are similarly productive but heterogeneous in mechanism precision (Mehmood 2010; Marshall 2009; Scheer 2017).
Street networks and built form provide durable traces of these processes, but durability creates an interpretive problem. The same physical container can host very different groups and activities across periods. A road pattern can persist while economic routines change; a building type can endure while social meaning shifts; a neighborhood can be recomposed by new combinations of users and uses without full replacement of its physical scaffold (Jacobs 1969; Duranton and Puga 2001). An evolutionary account therefore needs to explain physical persistence and functional recoding together.
2.2 TUEM as a Model of Urban Evolution
TUEM addresses this problem through a four-paper model architecture. Part I defines the context and the need for an evolutionary approach to urban form (Silver, Adler, and Fox 2022). Part II formalizes the formeme as information about physical organization for activities and groups (Fox, Silver, and Adler 2022). Part III specifies variation, selection, retention, and trajectory mechanisms (Silver, Fox, and Adler 2022). Part IV formalizes signature distance for longitudinal and transversal comparison (Fox, Silver, Silva, and Zhang 2022).
This architecture matters because it turns broad evolutionary language into explicit model objects. A signature is a time-stamped bundle of physical form, activities, and groups. Distance compares signatures. Trajectory compares sequences of signatures through time. Mechanisms such as variation, selection, retention, recoding, longevity, fidelity, and fecundity become testable only when these objects are measured consistently.
TUEM's contribution is a disciplined unit-of-analysis strategy as well as a conceptual synthesis. It aligns with Darwinian sociocultural accounts that require explicit replicator/vehicle or reproduction/selection logic in social domains while avoiding direct biological reductionism (Blute 2010; Mesoudi, Whiten, and Laland 2004; Dawkins 1982; Hull 1981; Wilkins and Bourrat 2022). In urban terms, this means claims must be written so that potential variation sources, selection conditions, and retention channels can be observed and compared.
2.3 From Model Terms to Observable Claims
This paper asks whether TUEM terms can be made empirically accountable. The bridge is the observable claim. Each claim must specify the model statement, the expected empirical pattern, the required data, the evidence rule, and the implication for the model if the pattern is supported, narrowed, or rejected. Proxy-based evidence is therefore treated as part of theory evaluation rather than as a preliminary defect to be hidden: the empirical task is to determine what the available traces can and cannot carry.
The empirical structure follows TUEM's mechanism families. Signature claims test whether physical-only comparison is sufficient. Variation claims test recombination and pathway entry. Selection claims test whether density, saturation, proximity, scope, content similarity, and frequency alter pathway outcomes. Retention claims test persistence, recoding, and reproduction mechanisms. Trajectory claims test classification, speciation, role ecology, and scale dependence.
This claim structure gives mixed and negative results a defined scientific role. They identify where mechanism statements are over-broad, under-measured, or scale-bound. A claim may therefore be retained, narrowed, split, deferred, or rejected under the measurements available for it.
The next section explains how model terms are translated into empirical measures and how the main analysis evaluates claim results.
3. Data and Methods
Section 2 defined the problem as a translation from TUEM's model terms to empirical claims. This section describes that translation. No single archive observes a complete TUEM signature, because physical form, groups, and activities are recorded by different institutions, at different spatial scales, and at different time intervals. The paper therefore constructs a linked evidence system that approximates signatures by observing physical form, formal establishments, and resident social composition together, over time, at tract and metropolitan scales. These records do not exhaust the meaning of urban form. They allow several central claims generated by the model to be evaluated through observable traces.
3.1 Units, Sources, and Scope
The main local unit is the census tract, a small statistical geography used by the U.S. Census Bureau to report neighborhood-scale population and housing data. Tracts are nested in core-based statistical areas (CBSAs), the Census Bureau's metropolitan and micropolitan labor-market areas. The analysis uses 16,808 tract histories across 401 CBSAs in the trajectory-terrain analysis, with narrower samples where a claim requires stricter temporal alignment or complete model covariates.
The physical component, P, comes primarily from CHRONEX-US and linked built-maturity records. CHRONEX-US estimates historical road-network expansion from contemporary road geometries and historical built-up areas, allowing the analysis to describe road-cohort structure, road-kilometer growth, branch shares, connector and infill shares, outward extension, grid and loop inheritance, and built maturity (Uhl, Burghardt, and Leyk 2025). These measures make road form a strong proxy for the physical component of a signature. They do not observe every parcel, building, zoning, transit, ownership, or institutional change.
The group component, G, comes from the LTDB, decennial census data, and ACS sample-period data. These sources measure resident social composition: tenure, age structure, race and ethnic composition, education, occupation, poverty, foreign-born population, and related diversity measures. They are appropriate for tract social context, but they do not directly observe all users of a place, including commuters, visitors, proprietors, landlords, institutional actors, or temporary populations.
The activity component, A, comes from ZBP and CBP. These federal business records describe formal establishments, employment size classes, payroll, and industry categories by ZIP/ZCTA, county, and metropolitan geography. In this paper, they are used to measure establishment density, broad industry-family composition, activity diversity, local services, office and knowledge services, retail and hospitality, logistics, production and distribution, manufacturing, construction, infrastructure, and institutional services. The term activity therefore has a precise scope: it means observed formal-establishment activity, not the full range of human practice in urban space.
Because activity and tract geographies do not coincide perfectly, the activity layer is crosswalked from ZCTA and county records to tract and CBSA frames where the evidence design requires it. The annual ZBP panel covers 1994-2023. In the tract-ZCTA frame, median high-coverage tract-year support is 95.9 percent and median high-or-usable support is 97.7 percent. In the allocation used for the analysis, 97.0 percent of records have at least 95 percent areal support, and the median largest single-ZCTA share is 96.9 percent. CBP county and CBSA checks show close agreement with the constructed activity profiles: in matched county records, the median establishment ratio is 0.998 and weighted profile correlations for major activity families range from 0.938 to 0.986; in matched CBSA records, the median establishment ratio is 0.973 and weighted profile correlations range from 0.941 to 0.986. These checks support the activity layer as a usable proxy, while leaving its substantive scope explicit.
Analysis Samples Used in the Main Text
| Evidence frame | Main use | Sample |
|---|---|---|
| Physical terrain histories | Road-terrain classification, expansion, and recombination | 16,808 tract histories; 401 CBSAs |
| Aligned P-G-A movement histories | Component durability, activity-profile movement, and rich trajectory types | 16,574 tract histories; up to 400 CBSAs |
| Direct saturation transitions | Activity saturation and substitute outcomes | 1,995 transitions; 146 CBSAs |
| Industry-code-consistent saturation rows | Activity saturation and substitute-or-hybrid outcomes without SIC/NAICS period mixing | 2,083 rows; 368 CBSAs |
| Alternative saturation specification | Sensitivity check for the saturation result | 2,085 rows; 369 CBSAs |
Table 1. TUEM Terms and Data Layers Used in This Paper
| Term | Meaning in TUEM | Empirical use in this paper | Main limit |
|---|---|---|---|
| Formeme | Information about how space is physically organized, what activities it supports, and which groups it is for. | Approximated through linked P, A, and G measures: road form and built maturity; establishment activity; tract social composition. | These data observe measurable traces of formemes, not the full content of urban meaning. |
| Signature | The representation of a spatial area at a time, locating formemes in both space and time. | Built as a time-stamped bundle of road form, formal establishments, and resident social composition for tracts and CBSAs. | Component timing differs, so some signatures are aligned across nearby windows rather than perfectly co-observed. |
| Physical form, P | How space is materially organized. | Measured through road age, road length, intersection density, dead-end and terminal shares, connector and infill shares, gridness, orientation, and built maturity. | Strongest for road networks and built timing; parcels, buildings, zoning, transit, utilities, ownership, and institutional form are undermeasured. |
| Activities, A | What the space is for and what people or organizations do there. | Measured through ZBP and CBP establishment and employment records, broad sector mix, activity diversity, and activity-family profiles. | Captures formal establishments better than informal, household, visitor, online, or institutional activity. |
| Groups, G | Who the space is for and which users or social groups are associated with it. | Measured through LTDB, census, and ACS variables describing resident social composition. | Describes resident populations better than all users, visitors, owners, workers, or institutions. |
3.2 From Signatures to Trajectories
A signature is a time-stamped bundle of P, G, and A. A trajectory is a sequence of such bundles. The analysis therefore uses two kinds of distance. A transversal distance compares two places at one time or window. A longitudinal distance compares one place across two times or windows. Both distances matter because TUEM claims address similarity at a point in time and movement through signature space.
The main P-G-A movement summaries align signature states around 1994, 2000, 2010, and 2015, using the nearest available observations when components are not recorded on exactly the same schedule. The physical component is built from road-history and built-maturity measures; the group component from decennial census, LTDB, and ACS resident-composition measures; and the activity component from the 1994-2023 ZBP/CBP formal-establishment panel. Component distances are standardized within the relevant comparison frame before they are added or converted into shares, so the reported P, G, and A shares describe relative movement within the measured signature, not raw kilometers, population percentages, or establishment counts. A zero or near-zero physical share therefore means that road-form measures changed little relative to the measured group and activity components in that tract history.
The first translation problem is classification. A road-network measure can identify outward extension, subdivision branching, stitched infill, grid/loop inheritance, branch-and-stitch hybrids, and mixed incremental change. These terrain families are physical trajectories: they describe how road building extends, branches, connects, or inherits prior structure. The terrain family is not yet a full urban-evolution interpretation, because two tracts with the same physical terrain can differ in social and establishment histories.
The second translation problem is component movement. For each tract history with aligned measures, physical, group, and activity movement are scaled within their comparison frame and converted into shares of total observed movement. The resulting P-G-A trajectory family identifies whether the observed path is retained/stable, activity-led, group-led, physically led, or coupled across components. This classification is descriptive: it tells which part of the observed signature moved most in the measured interval. It does not by itself identify a causal driver.
Retained/stable movement is assigned before component dominance is evaluated: a tract with a short total path is classified as retained/stable even if one component accounts for most of that small amount of movement. Activity-led, group-led, and physical-led movement identify the component with the largest share of observed movement after that total-path screen. Coupled movement identifies cases where more than one component moves substantially. These labels are descriptive. They identify which part of the observed signature moved most, not what caused the movement.
The third translation problem is claim testing. In this paper, testing means studying observable implications. A claim is not treated as proven because a concept can be named in the data; it becomes empirically accountable only when the model statement implies a measurable pattern. Each claim in Section 4 is therefore evaluated by specifying the model statement, observable implication, measurement strategy, empirical result, and implication for TUEM. A result supports a claim when the measured pattern matches the observable implication under the relevant design. A result narrows a claim when support appears only under particular spatial scales, data resolutions, or eligibility rules. A result counts against a broad claim when the eligible comparison moves in the opposite direction. A question remains untested when the required data are unavailable at the needed resolution.
3.3 Inference and Limits
The paper's claims are descriptive and model-evaluative rather than causal. The central tests ask whether observable patterns are consistent with selected TUEM implications: whether physical terrain families become more informative when crossed with group and activity histories, whether component pace differs across P, G, and A, whether expansion and recombination form distinguishable pathways, whether stable physical containers carry changed group or activity profiles, and whether one deliberately narrow saturation implication predicts substitute or hybrid pathways. These are tests of observable implications, not estimates of exogenous treatment effects or requirements that TUEM reduce to a single mechanism.
Several limits follow directly from the data structure. CHRONEX-US supports long-run road and built-maturity analysis but cannot observe all physical transformations. Census and ACS data describe residents, not all groups that use or control urban space. ZBP and CBP describe formal establishments, not all activities. These limits are not incidental; they define what the evidence can and cannot mean. The analysis therefore avoids claims about mechanisms that require unobserved zoning, ownership, parcel, building, informal activity, visitor, or institutional data.
The empirical design keeps each claim at the level supported by its measures. Component durability is specified as a question about relative movement among physical, group, and activity components. Recoding is treated as a theoretical interpretation of low physical movement paired with higher group or formal-establishment movement, not as direct observation of building reuse, zoning change, ownership strategy, or lived meaning. The saturation test requires a positive relationship between prior formal-establishment saturation and substitute or hybrid outcomes after physical-pathway context is included. Persistence and reproduction are defined as distinct retention outcomes: persistence refers to survival of inherited physical structure, while reproduction alignment refers to later development that continues a prior pattern.
Claim Structure
| Claim | Evidence type | Observable implication | Evidence used | Result |
|---|---|---|---|---|
| Trajectory classification | Constructed classification | Road histories should form recurrent pathway families that are not reducible to present morphology alone. | Physical terrain histories | Supported as a road-history classification, not as independent mechanism validation. |
| Conditional component durability | Descriptive empirical pattern | Physical movement should often be lower than group or activity movement, but the slowest component may vary by pathway and window. | Aligned P-G-A movement histories; component shares; robustness checks | Narrowed: physical form is often stable, but no universal slowest-component law is supported. |
| Expansion versus recombination | Constructed classification | Outward extension, subdivision branching, stitched infill, inherited connected layouts, and hybrid cases should have different road-terrain profiles. | Road-terrain measures and terrain mix by movement family | Supported as a terrain classification. |
| Same terrain, different bundled histories | Descriptive classification plus null benchmark | A physical terrain family should appear with more than one group/activity movement history; a stronger sorting claim would require observed association beyond shuffled context. | Rich trajectory types and shuffled-context permutation check | Supported only as descriptive classification; the shuffled benchmark does not support a strong terrain-to-context sorting mechanism. |
| Activity-profile movement within stable containers | Descriptive association and construct-validity target | Stable or low-moving road containers should sometimes be paired with substantial resident-composition or formal-establishment movement. | Component-movement families, rich trajectory types, illustrative lineages, activity-geography checks | Supported with scope limits; interpreted as a trace consistent with recoding, not direct evidence of reuse mechanisms. |
| Activity saturation and substitution | Mechanism-like selection test | Prior formal-establishment saturation should positively predict substitute or hybrid outcomes after physical-pathway context is included. | Direct transition and industry-code-consistent saturation models | Not supported as a broad mechanism. |
4. Analysis
The analysis follows the claim structure above. It begins with trajectory classification because the paper's central measurement problem is whether urban evolution can be represented as histories rather than present physical forms alone. It then asks whether P, G, and A differ in relative movement; whether expansion and recombination form distinct physical pathways; whether similar terrain can carry different histories; whether stable physical containers are associated with activity-profile or resident-composition movement; and whether activity saturation selects substitute or hybrid forms. The sequence is cumulative, but the evidentiary status changes across sections: trajectory and terrain claims are classification claims, same-terrain and stable-container claims are descriptive interpretations with sensitivity checks, and the saturation test is a mechanism-like selection test.
4.1 Trajectory Classification: Road Histories Are Not Static Morphologies
TUEM's trajectory logic states that places with similar present signatures can have different evolutionary meanings. A present road pattern is therefore an insufficient object of classification unless it is connected to the path by which it formed and to the group and activity histories that accompanied it. The observable implication is straightforward: a trajectory classification should reveal recurrent physical pathways and should show that those pathways are not reducible to one static morphology.
The measure begins with road-network histories. Each tract is assigned to a physical terrain family using the relative presence of branching, strict subdivision-style terminal structure, connector/infill stitching, outward extension, and inherited grid or loop structure. Figure 1 is read as a first map of physical evolutionary pathways. The bars show how many tract histories fall into each terrain family; the labels summarize what the family means in ordinary road-building terms.
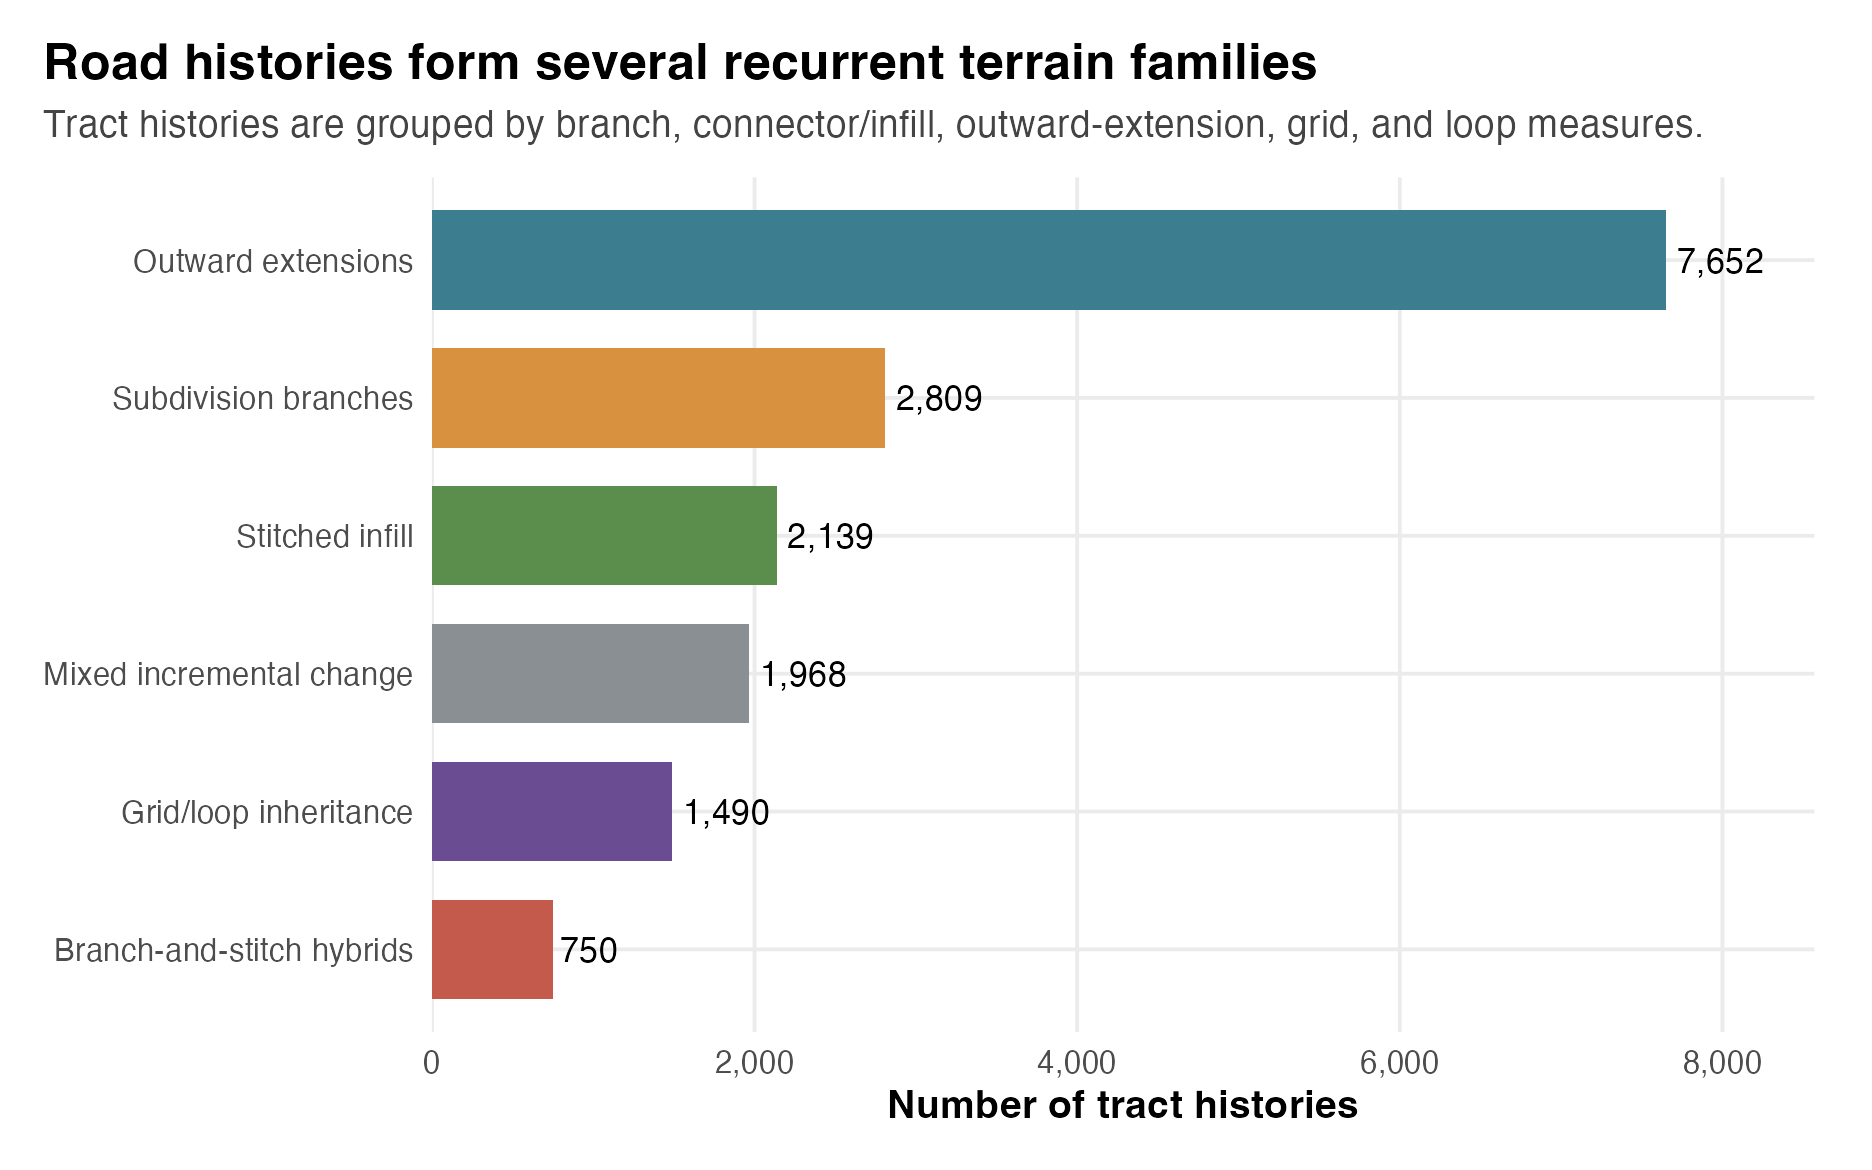
Figure 1. Physical trajectory terrain families. The figure classifies tract road histories into six terrain families. Outward extensions are the largest family, but subdivision branches, stitched infill, grid/loop inheritance, branch-and-stitch hybrids, and mixed incremental change are all large enough to matter empirically.
The terrain classification identifies a differentiated physical field. Outward extensions are the largest family, with 7,652 tracts across 397 CBSAs and a median outward share of 0.767. Subdivision branches include 2,809 tracts across 312 CBSAs and have the highest median branch share, 0.669. Stitched infill includes 2,139 tracts across 192 CBSAs and has a median stitching share of 0.816. Grid/loop inheritance includes 1,490 tracts across 253 CBSAs; branch-and-stitch hybrids include 750 tracts across 196 CBSAs; and mixed incremental change includes 1,968 tracts across 319 CBSAs. These counts support the first step of the trajectory claim: road-network evolution appears as a set of recurrent pathways rather than a single continuum from old to new.
Table 2. Physical Terrain Families in the Trajectory Sample
| Terrain family | Tracts | CBSAs | Median branch share | Median stitching share | Median outward share |
|---|---|---|---|---|---|
| Outward ext. | 7,652 | 397 | 0.285 | 0.233 | 0.767 |
| Subdivision branches | 2,809 | 312 | 0.669 | 0.477 | 0.523 |
| Stitched infill | 2,139 | 192 | 0.375 | 0.816 | 0.184 |
| Mixed incremental | 1,968 | 319 | 0.551 | 0.551 | 0.449 |
| Grid/loop | 1,490 | 253 | 0.359 | 0.575 | 0.425 |
| Branch-stitch | 750 | 196 | 0.579 | 0.658 | 0.342 |
The implication for TUEM is that trajectory classification is empirically useful before mechanism claims are specified more tightly. TUEM's trajectory vocabulary does not simply rename existing morphology; it organizes observed histories into road-building pathways that can then be crossed with group and activity movement. The next test asks whether the three components in that crossed signature move at different rates.
4.2 Conditional Durability: Physical Form Often Persists, But Not as a Universal Hierarchy
TUEM gives physical form a special role because streets and inherited built structure can persist after social composition or activity patterns change. The empirical question is whether that durability appears as a universal temporal hierarchy or as a pathway-specific pattern. When P, G, and A are observed together, the test asks how often each component is the most durable part of the signature.
The measure uses aligned tract histories and computes the share of observed movement associated with physical form, group composition, and formal-establishment activity. A tract with a low physical share and a high activity share has a comparatively stable road container and a changing establishment profile. A tract with a high group share has social-context movement that exceeds physical and activity movement. Figure 2 is read as a typology of component movement, not as a causal explanation of why the movement occurred.
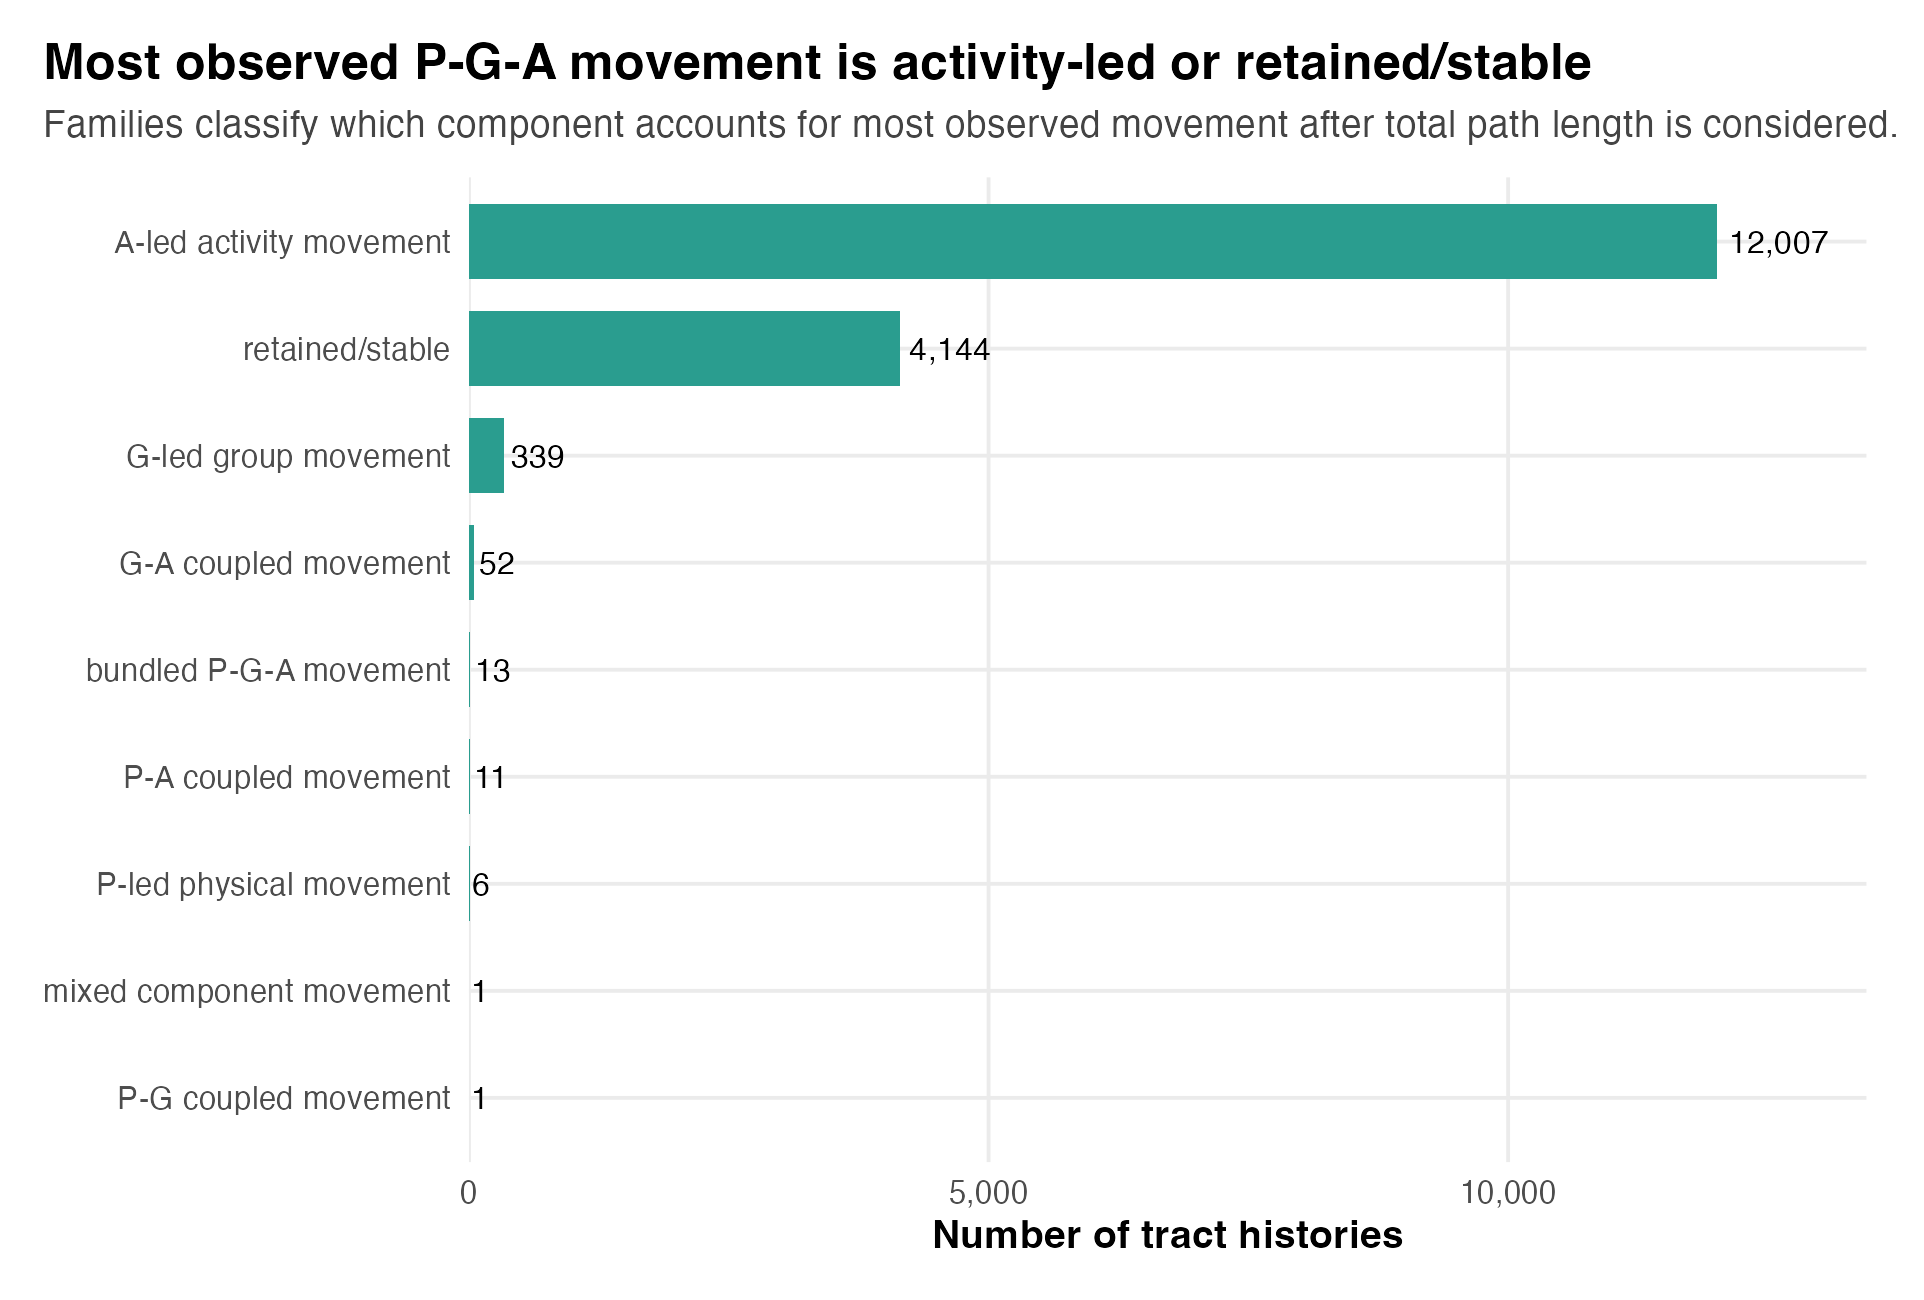
Figure 2. P-G-A trajectory families. The figure classifies tract histories by which component accounts for most observed movement. The activity-led category is the largest family, retained/stable pathways form the second largest family, and group-led or coupled movement appears in smaller but interpretable families. The labels are descriptive component-movement labels, not causal driver labels.
The observed trajectories do not support a universal physical-slowest rule, although they preserve the importance of physical durability. The activity-led category is the largest family, with 12,007 tracts across 400 CBSAs. Its median path has a physical share of 0.000, a group share of 0.252, and an activity share of 0.735. Retained/stable pathways include 4,144 tracts across 382 CBSAs and have a shorter median path, 0.044, compared with 0.076 for the activity-led category. Group-led movement is much smaller, with 339 tracts across 122 CBSAs, but it has the highest median group share, 0.544. Coupled P-G-A, P-A, and physical-led pathways are rare in the national tract sample.
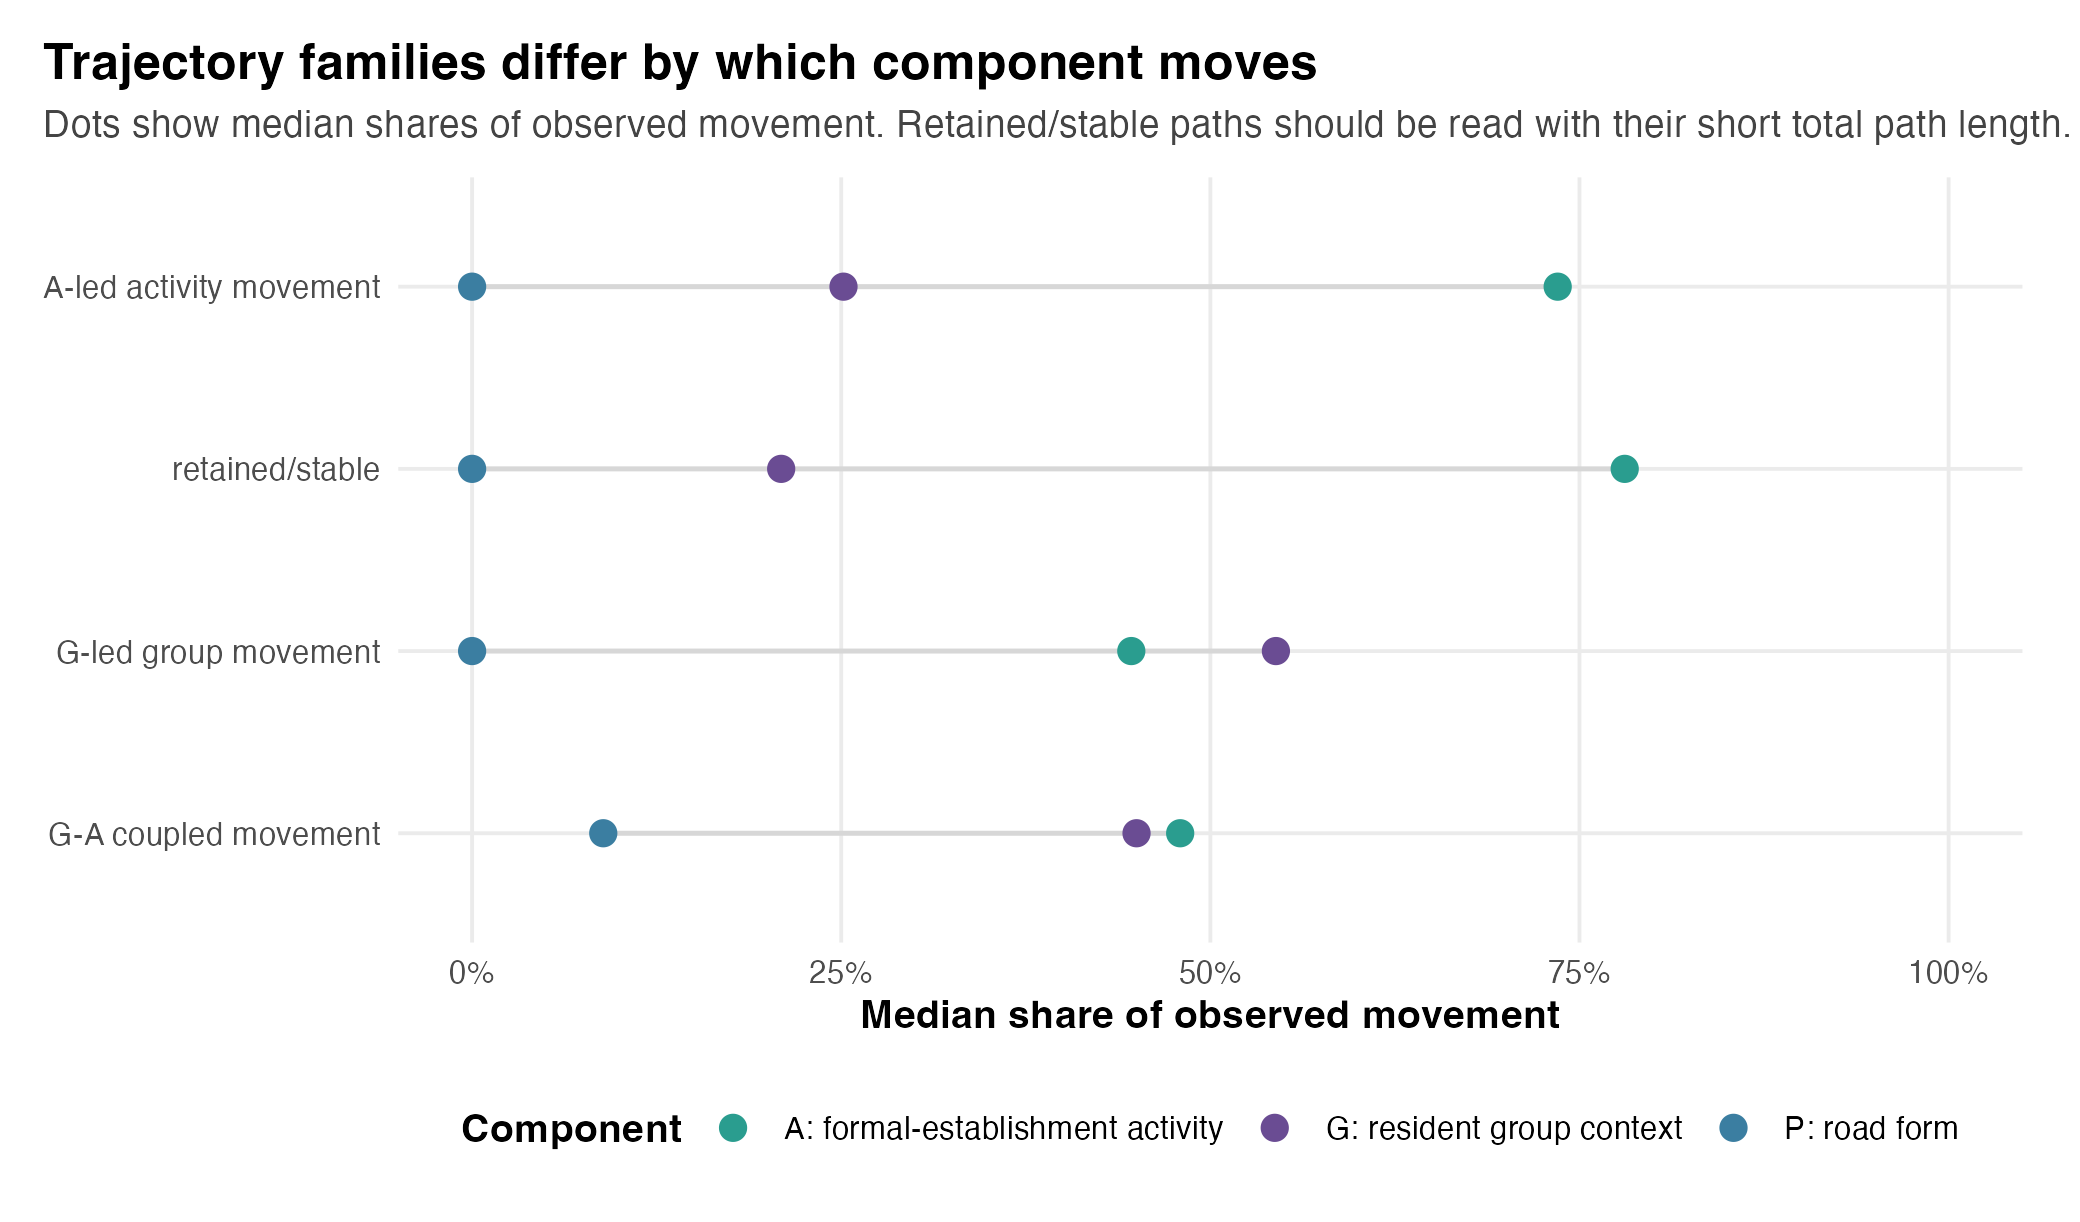
Figure 3. Component movement profiles by trajectory family. The figure shows how much observed movement is physical, group, or activity movement for the main readable families. It should be read together with total path length: retained/stable tracts have a high activity share only because their total movement path is short.
Table 3. Main P-G-A Movement Families
| P-G-A family | Tracts | CBSAs | Median path | Median P share | Median G share | Median A share |
|---|---|---|---|---|---|---|
| Activity-led | 12,007 | 400 | 0.076 | 0.000 | 0.252 | 0.735 |
| Retained/stable | 4,144 | 382 | 0.044 | 0.000 | 0.209 | 0.781 |
| Group-led | 339 | 122 | 0.130 | 0.000 | 0.544 | 0.446 |
| Group + activity | 52 | 36 | 0.131 | 0.089 | 0.450 | 0.480 |
| All components | 13 | 12 | 0.107 | 0.314 | 0.234 | 0.452 |
| Physical + activity | 11 | 11 | 0.122 | 0.381 | 0.182 | 0.435 |
| Physical-led | 6 | 5 | 0.171 | 0.550 | 0.088 | 0.305 |
Note: retained/stable is assigned by short total path before component dominance is evaluated. Component shares in that row therefore describe shares of a small total movement path.
Two one-tract residual categories, mixed component movement and P-G coupled movement, appear in Figure 2 but are omitted from Table 3 because they do not support stable family-level interpretation.
The component result narrows the durability claim. Physical form often supplies the durable container: in the two largest families, the median physical movement share is zero. Yet the principal observed movement is often in formal-establishment activity rather than resident social composition, and small coupled families indicate that some places do move across components. This result should be read as relative movement under the paper's measurement cadence, not as an absolute law of component speed. Roads and built maturity are slow-moving and partly historical; census and ACS are periodic; ZBP is annual after 1994. The implication for TUEM is conditional durability: physical form often constrains and carries urban evolution, while the relative pace of P, G, and A varies by pathway, measurement window, and activity geography.
4.3 Expansion and Recombination: Distinct Road-Building Pathways
The expansion/recombination claim gives a second interpretation to the road-history classification introduced in Section 4.1. It is not an independent validation of the same classification. It asks whether the classified road histories preserve a theoretically important distinction between added extent and synthesis. Expansion adds road form outward from or away from the previous network. Recombination stitches new connections into existing fabric, mixes branching and infill, or reuses inherited grid and loop structure. The observable implication is that road terrains should not collapse into one growth category: outward extension, subdivision branching, stitched infill, inherited connected form, and hybrid branching-stitching should have different empirical profiles.
The measure uses the same road-terrain variables from Section 4.1, but the comparison now asks which physical terrains underlie each P-G-A movement family. Figure 4 is read by row: each row is a P-G-A movement family, and the colors show the road-terrain composition of that family by road kilometers.
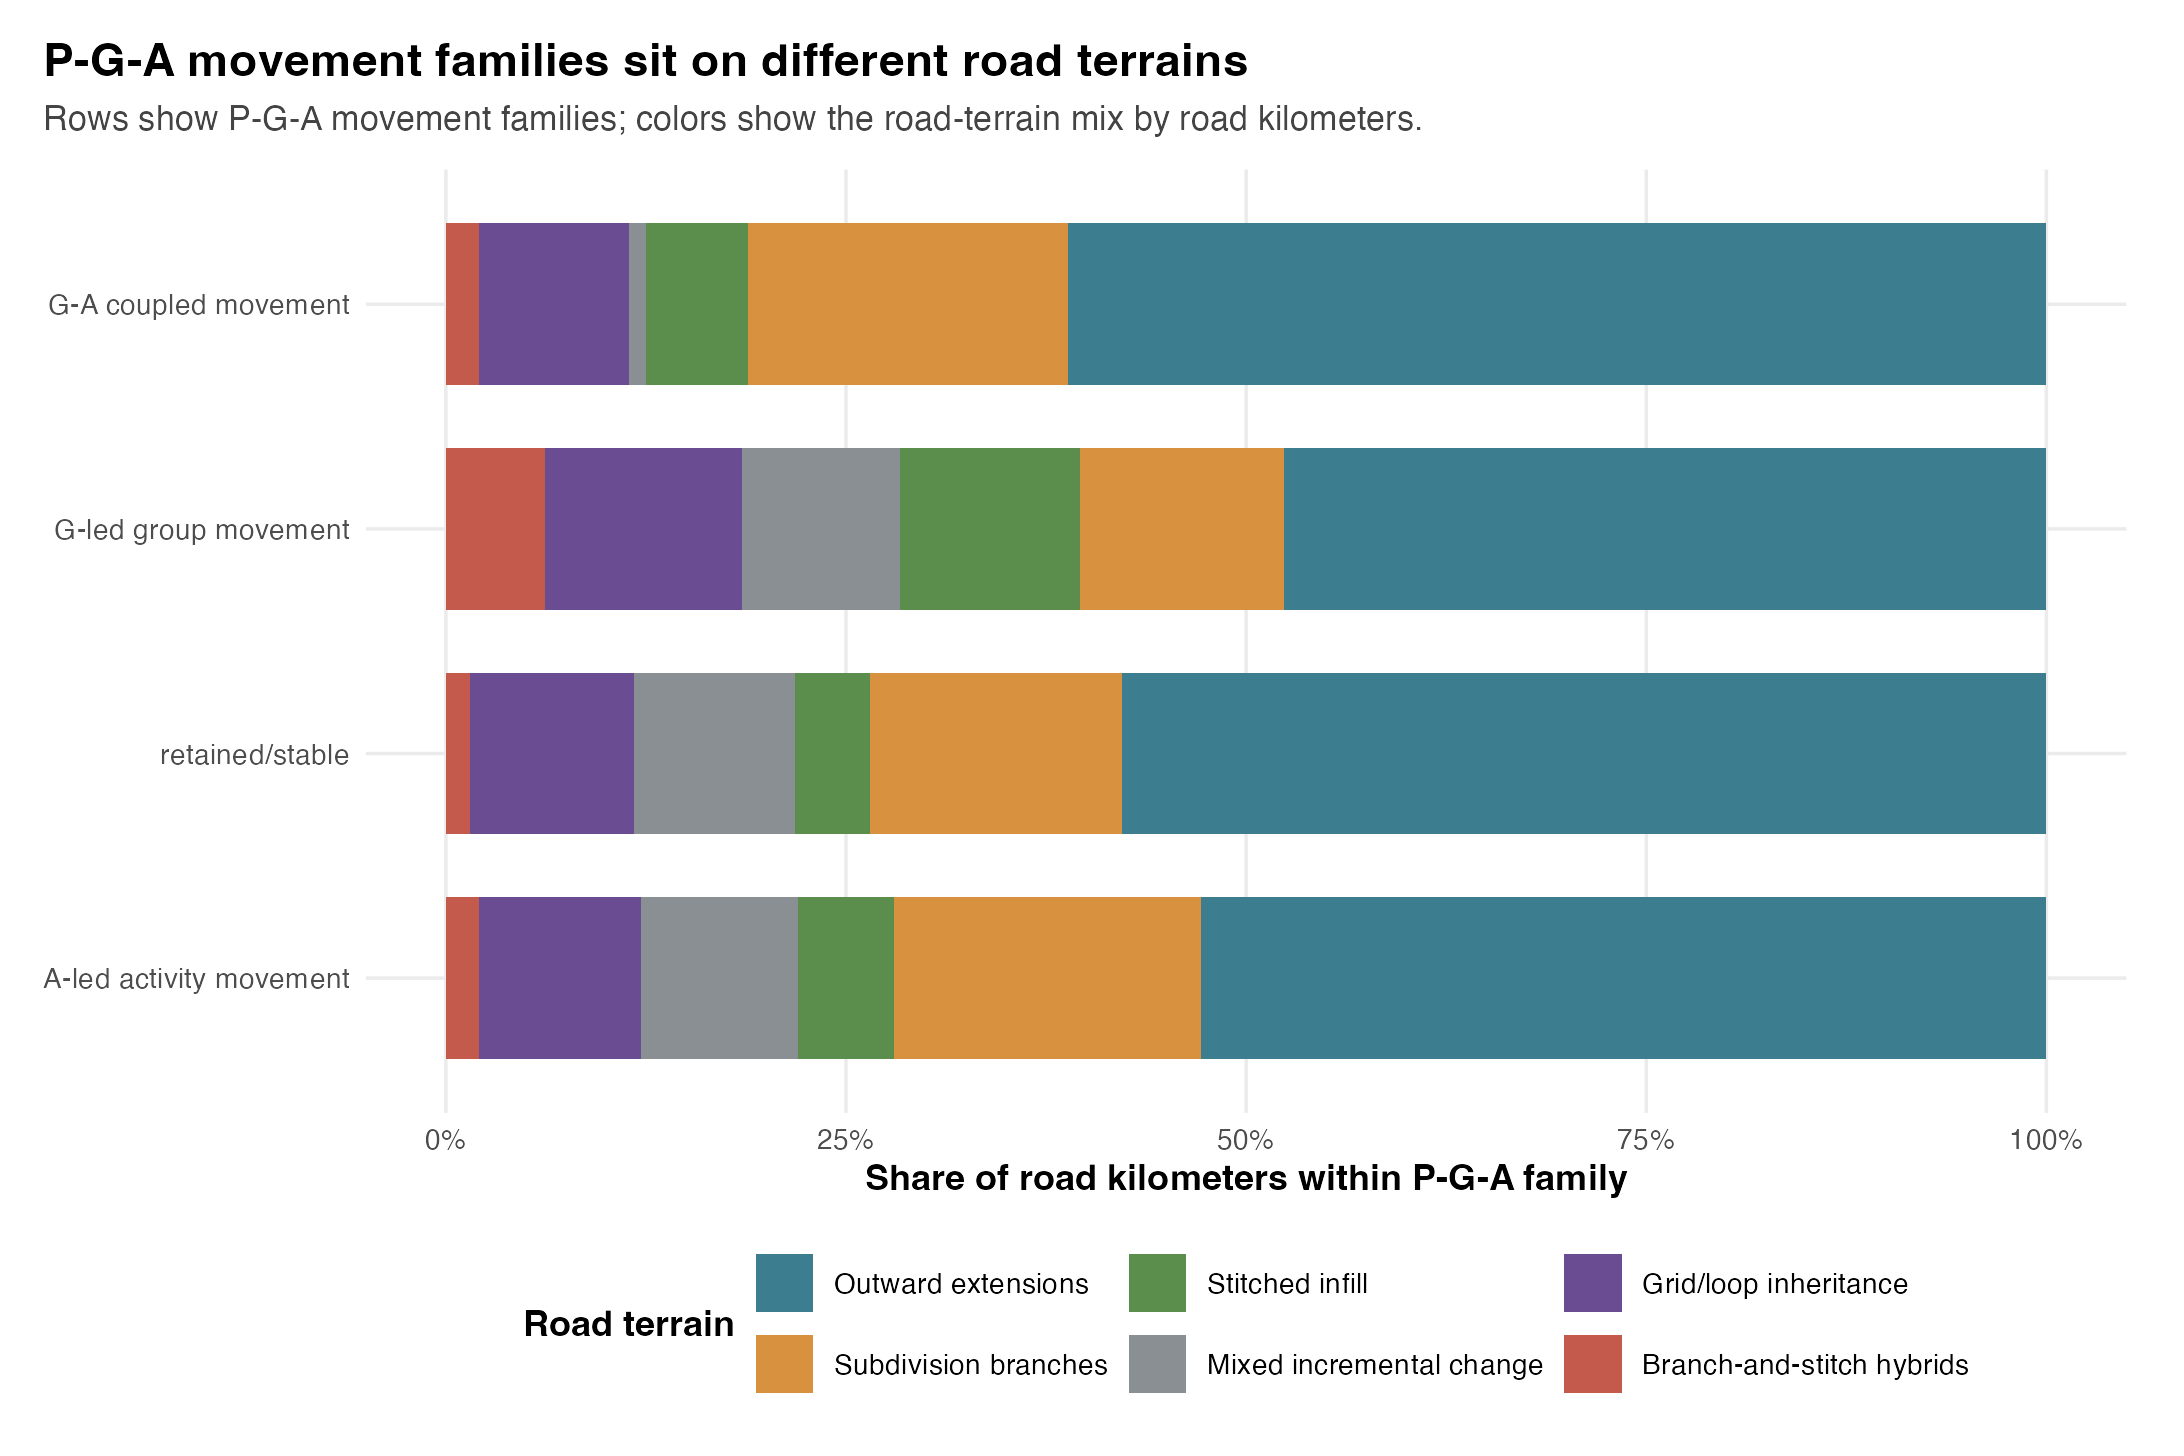
Figure 4. Road-terrain mix by P-G-A family. The figure shows the physical terrain associated with each P-G-A movement family. It helps separate expansionary paths from recombinatory and hybrid paths, while also showing that activity-led movement appears across several physical terrains.
The terrain families support the expansion/recombination distinction. Outward extensions are defined by a high median outward share, 0.767, and comparatively low stitching, 0.233. Stitched infill reverses that profile, with median stitching 0.816 and outward share 0.184. Subdivision branches show high branching, 0.669, while branch-and-stitch hybrids combine substantial branch and stitching shares, 0.579 and 0.658. Grid/loop inheritance is neither simple outward growth nor pure infill: it has a median stitching share of 0.575 and identifies places where connected layouts persist or are repeated.
Figure 4 adds a second reading: the same P-G-A movement family can sit on several road terrains, but the terrain mix is not identical across movement families. Activity-led movement is distributed across outward extensions, subdivision branches, stitched infill, mixed incremental change, and grid/loop inheritance. Retained/stable paths are also dominated by outward extensions but retain visible shares of inherited grid/loop and mixed incremental terrain. The rarer group-led and group-activity coupled rows have their own terrain mixes, though their small counts make them better treated as suggestive classifications than as stable national proportions.
The result supports expansion and recombination as a classification distinction. Expansion and recombination are empirically separable in the road record, and hybrid cases are not noise; they are important because they mark tracts where subdivision-style branching and later stitching coexist. The implication for TUEM is that its variation vocabulary should distinguish added extent from recombined fabric. The next section asks what happens when these physical pathways are crossed with group and activity histories.
4.4 Bundled Histories: The Same Terrain Can Carry Different Activity and Group Movement
The same-terrain claim states that similar physical form can encode different formemes when group or activity context differs. In trajectory terms, the claim becomes sharper: the same physical terrain can carry retained, activity-moving, group-moving, or coupled histories. This test can show whether physical terrains map one-to-one onto P-G-A histories; it cannot by itself show that terrain sorts those histories. The observable implication is that the richest trajectory types should cross physical terrain families with P-G-A movement families rather than lining them up one-to-one.
The measure forms a rich trajectory type by combining the road-terrain family with the P-G-A movement family. Figure 5 is read as a distribution of these combined histories. If physical terrain determined the whole urban-evolution path, one or two combinations would dominate and the rest would be marginal. If physical terrain is incomplete as a signature label, the same terrain should appear with multiple movement histories.
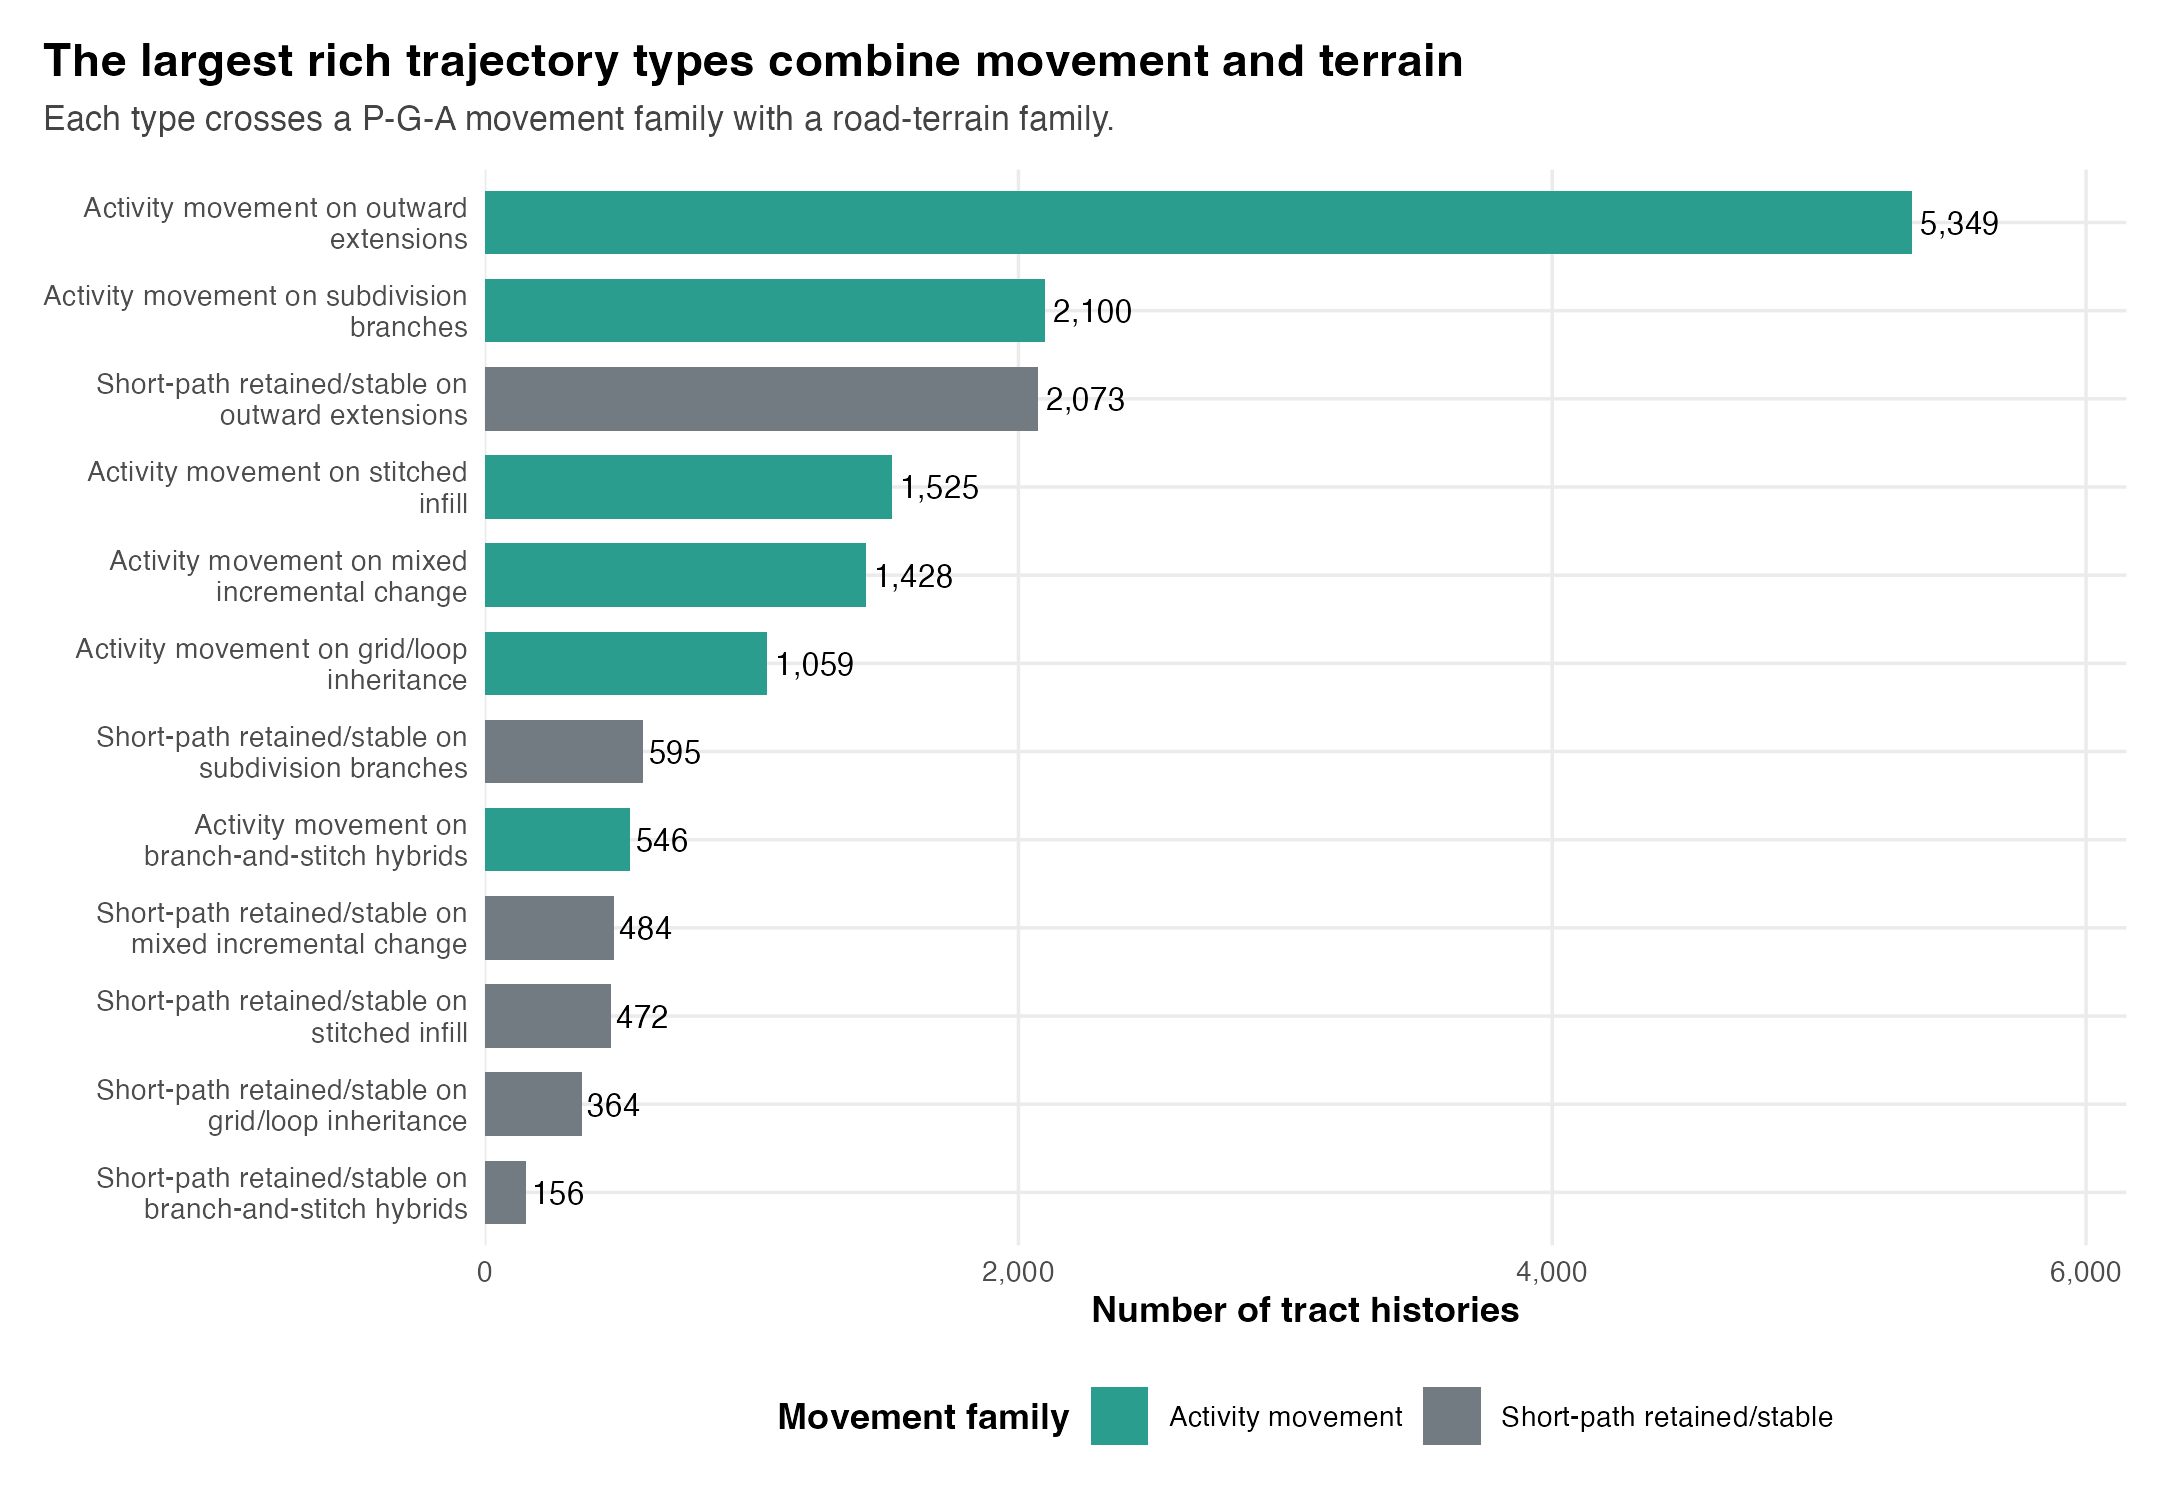
Figure 5. Rich trajectory type counts. The figure combines physical terrain families with P-G-A movement families and shows the largest combined types. The largest types are activity-led movement on outward extensions, activity-led movement on subdivision branches, retained/stable packages on outward extensions, and activity-led movement on stitched infill.
The combined typology shows why physical terrain alone is incomplete. The largest type is activity-led movement on outward extensions, with 5,349 tracts across 390 CBSAs, 32.3 percent of the rich-trajectory sample. The second is activity-led movement on subdivision branches, with 2,100 tracts across 291 CBSAs, 12.7 percent. The third is a different history on the same broad expansionary terrain: retained/stable packages on outward extensions, with 2,073 tracts across 326 CBSAs, 12.5 percent. Activity-led movement also appears on stitched infill, mixed incremental change, and grid/loop inheritance.
Table 4. Most Common Rich Trajectory Types
| Rich trajectory type | Tracts | CBSAs | Share | Median P | Median G | Median A |
|---|---|---|---|---|---|---|
| Activity + outward | 5,349 | 390 | 32.3% | 0.00 | 0.24 | 0.74 |
| Activity + subdivision | 2,100 | 291 | 12.7% | 0.00 | 0.25 | 0.73 |
| Retained/stable + outward | 2,073 | 326 | 12.5% | 0.00 | 0.20 | 0.79 |
| Activity + stitched | 1,525 | 172 | 9.2% | 0.00 | 0.27 | 0.73 |
| Activity + mixed | 1,428 | 298 | 8.6% | 0.00 | 0.26 | 0.73 |
| Activity + grid/loop | 1,059 | 225 | 6.4% | 0.00 | 0.26 | 0.74 |
The implication for TUEM is that physical terrain is necessary but not sufficient as a descriptive label. Outward extension can be associated with activity-profile movement or retained/stable packages. Stitched infill can carry changed establishment profiles. Grid/loop inheritance can host activity-profile movement rather than only physical continuity. A permutation check qualifies the inference: the observed off-dominant share within physical clusters, 51.7 percent, is close to the shuffled-context baseline of 53.1 percent, so this result should not be read as a strong sorting effect beyond the classification itself (Appendix D). The supported claim is therefore intentionally modest: similar physical forms can be paired with different observed group and formal-establishment histories, but the present test does not identify a distinct sorting mechanism that assigns those histories to terrains.
4.5 Stable Road Containers and Activity-Profile Movement
The retention and recoding claim asks how inherited physical form constrains change while also making reuse possible. In TUEM terms, retention has two sides: inherited physical structure can limit what changes, while new group or activity patterns can become absorbed into an existing urban container. The observable data cannot directly see adaptive reuse, zoning decisions, property strategy, building conversion, institutional control, or lived meanings. The empirical claim is therefore narrower: stable P paired with changing G or A is a measured trace that is consistent with recoding, but recoding as a mechanism requires additional local evidence.
The observable implication is that stable or low-moving physical containers should appear with substantial group or activity movement. The clearest national evidence comes from activity-profile movement, because the activity layer has annual formal-establishment records after 1994 and because activity-moving paths are large enough for comparison. The result establishes a recurrent association between physical persistence and establishment-profile change. A causal account of why those paths form would require additional evidence about ownership, zoning, building reuse, and institutional decision-making.
The quantitative basis for the stable-container interpretation is the combination of component movement and terrain crossing. In the aligned P-G-A movement sample, activity-profile-moving histories include 12,007 tracts across 400 CBSAs with a median physical movement share of 0.000 and a median activity movement share of 0.735. Retained/stable pathways add another 4,144 tracts across 382 CBSAs with short median total path length. In the rich trajectory types, activity-profile movement appears on outward extensions, subdivision branches, stitched infill, mixed incremental change, and grid/loop inheritance. This is therefore not a single morphology; it is a relationship between low measured physical movement and higher measured activity or group movement.
Figure 6 gives a place-based reading of the typology. Each line traces an exemplar through P-G-A signature space. The vignettes were selected to make the main activity-moving pattern visible across different physical terrains while also retaining contrast cases for group-moving, physical-moving, and bundled movement. The lineages make the abstract classification visible: some tracts move mainly in activity, some mainly in group, some in coupled ways, and a few in physical form. The figure is read as a lineage diagram rather than as a map; it shows how the same vocabulary can describe different histories.
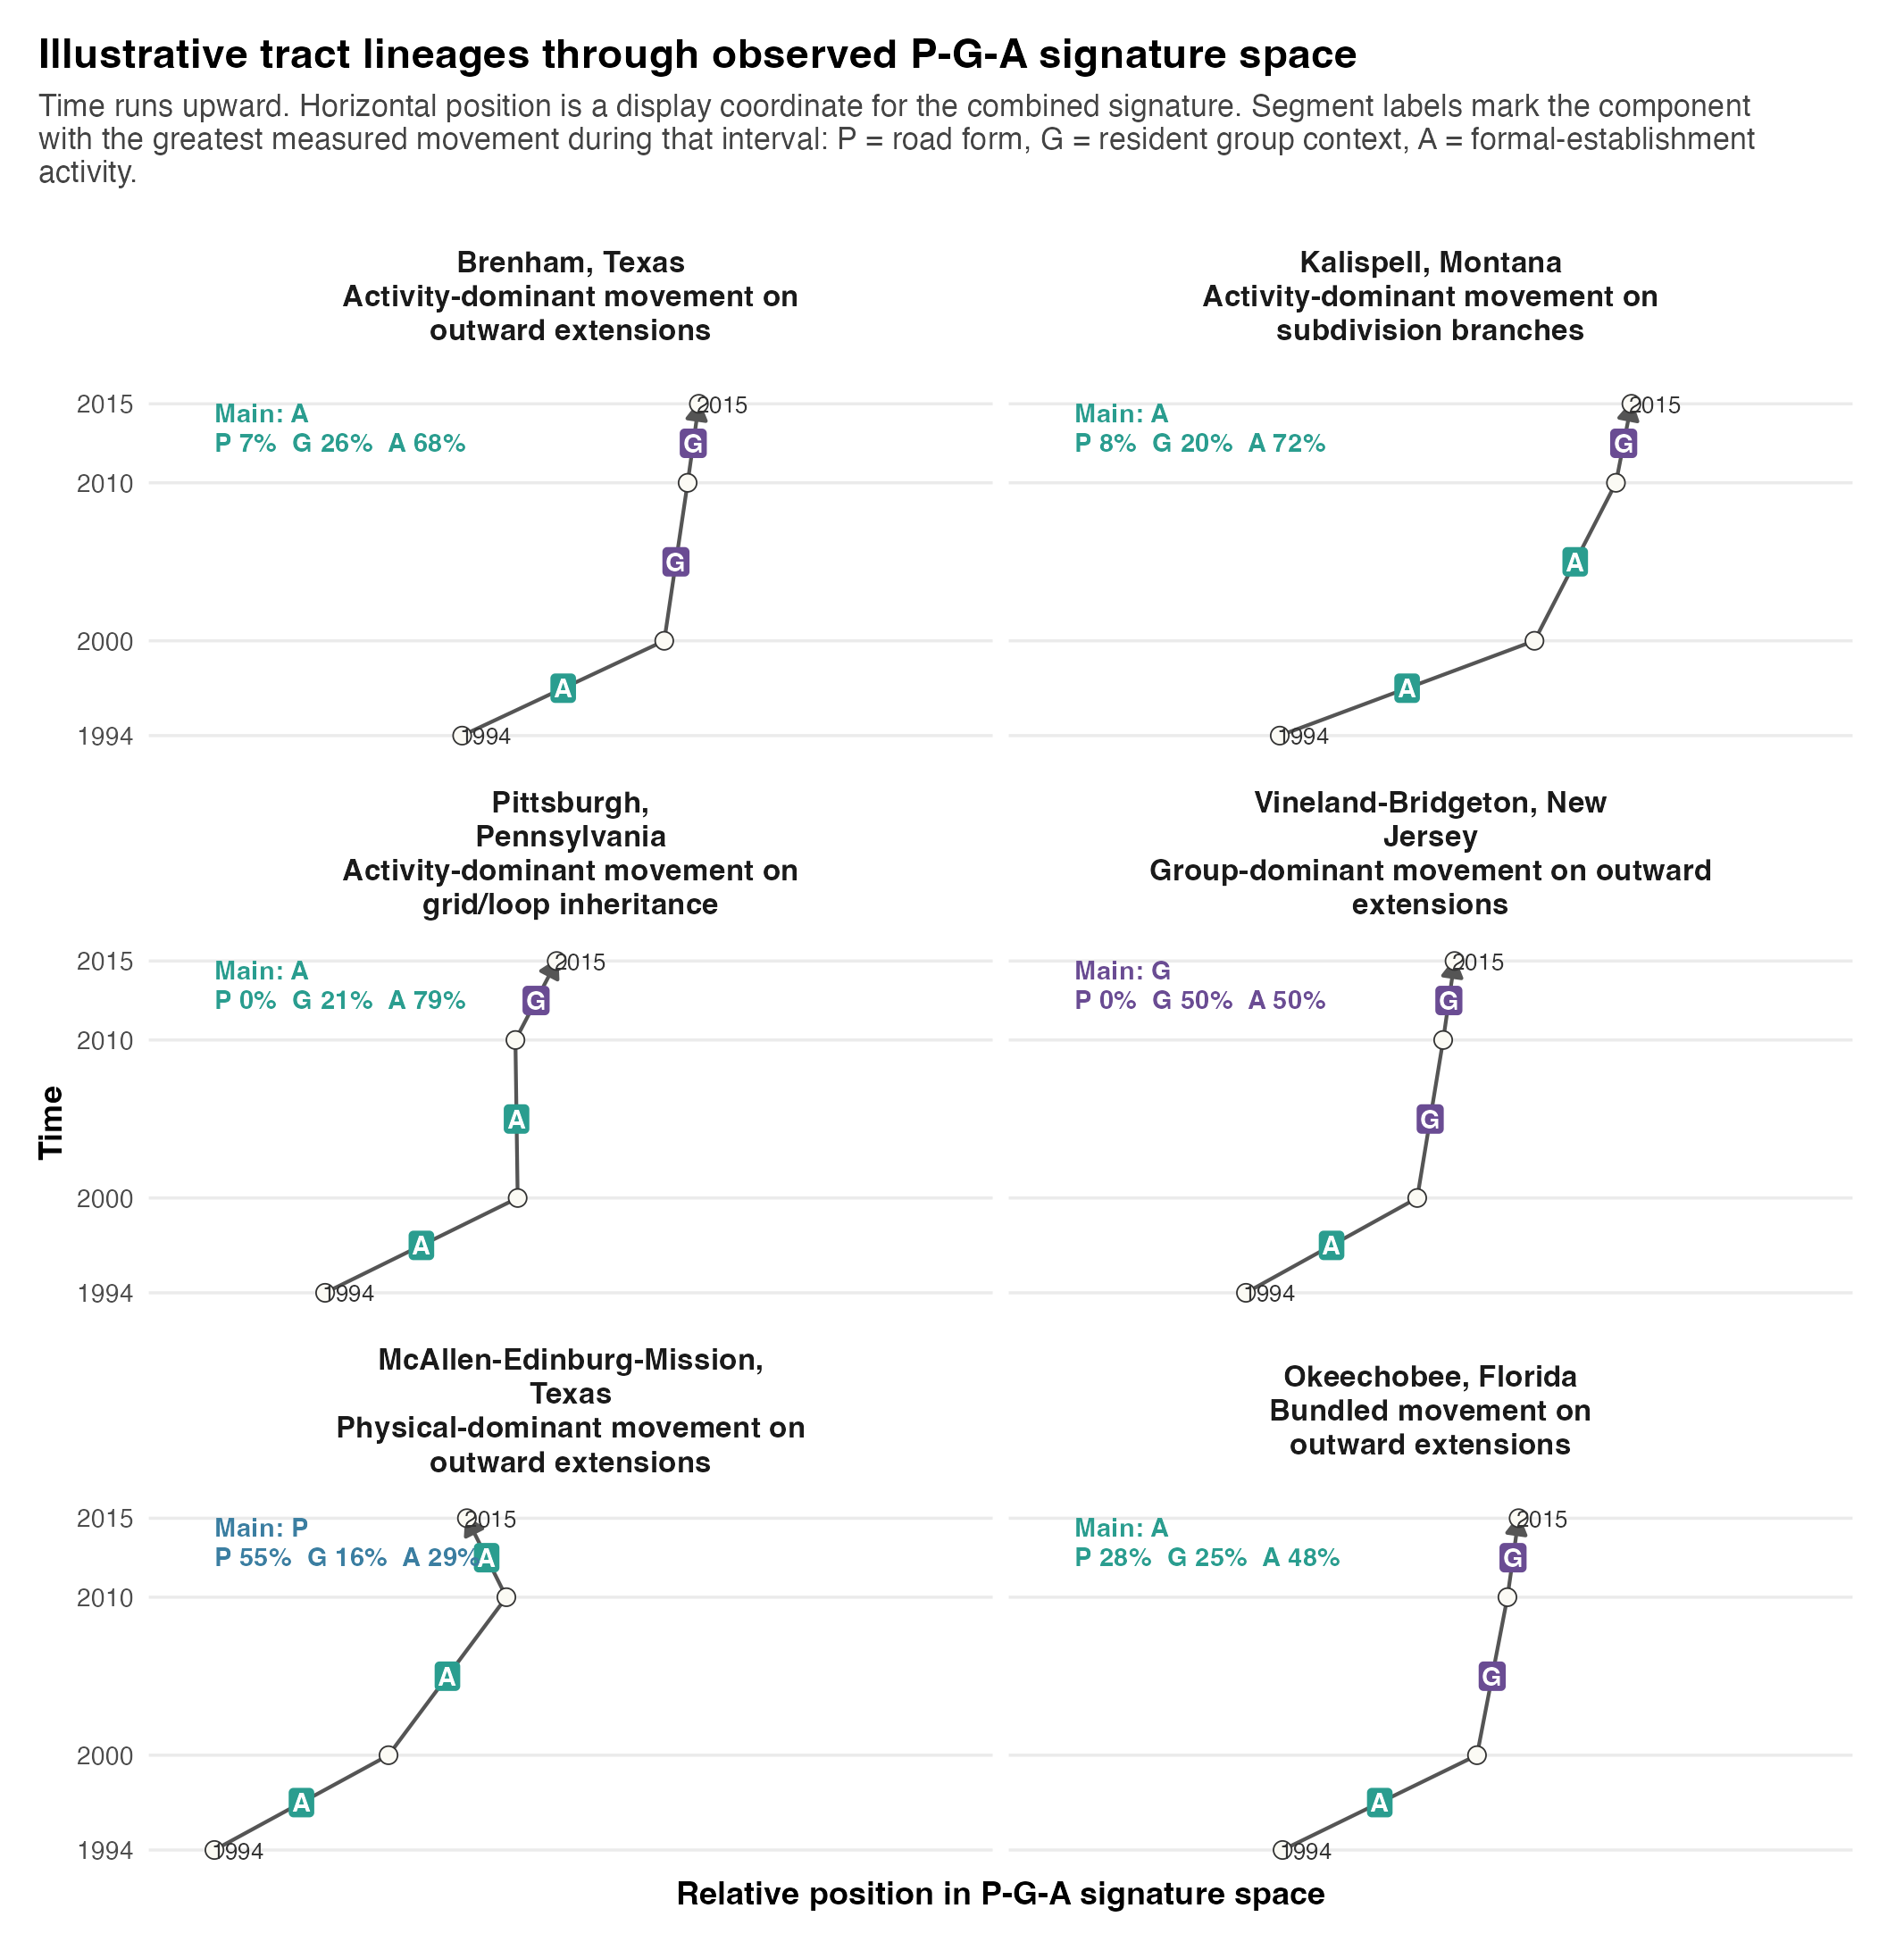
Figure 6. Vignette lineages through signature space. The lineages show selected tracts moving through P-G-A signature space. Brenham, Kalispell, and Pittsburgh illustrate activity-profile movement in different physical containers; Vineland-Bridgeton illustrates group movement; McAllen-Edinburg-Mission illustrates a rare physical-movement case.
The vignettes clarify the stable-container result. Brenham, Texas, is classified as activity-led movement in an outward road container, with movement shares of 0.07 for P, 0.26 for G, and 0.68 for A. Kalispell, Montana, shows activity-led movement on a subdivision fabric, with shares of 0.08, 0.20, and 0.72. Pittsburgh, Pennsylvania, shows activity-led movement on inherited grid and loop fabric, with shares of 0.00, 0.21, and 0.79. These are not interchangeable places. They show that the same component movement family can appear in different physical terrains, and that different terrains can serve as containers for changed formal-establishment profiles.
The implication for TUEM is a bounded stable-container claim. TUEM's retention language is useful because it distinguishes physical survival from full signature stability. A stable road container can be associated with changing establishment activity or changing resident composition; that is the empirical basis for interpreting possible reuse and recoding. The claim is bounded because the evidence observes road form, resident composition, and formal establishments. It does not directly observe property regimes, zoning decisions, institutional control, building-level reuse, or lived meanings. Those mechanisms are plausible routes of recoding, but they require additional data before they can be treated as tested.
4.6 Measurement and Prediction Checks
Because classification alone is insufficient evidence, the analysis uses three sensitivity checks to ask how much of the result survives beyond the preferred typology.
The first sensitivity check concerns the activity proxy. Tract-level activity is allocated from ZIP/ZCTA business records, so the paper checks whether the main activity-moving classification is confined to poor geography matches. It is not. Across trajectory classifications grouped by tract-ZCTA quality, the activity-led share is 74.1 percent in high-coverage cases, 74.7 percent in lower-coverage cases, and 71.7 percent where coverage is unavailable; retained/stable shares are 23.6, 22.4, and 25.8 percent respectively. A stricter geography-support frame, requiring total tract-area coverage of at least 0.95 and largest single-ZCTA overlap of at least 0.90, contains 1,949 rows across 276 CBSAs, with median tract-area coverage and median largest-ZCTA support both at 100.0 percent. These checks do not prove building-level activity, but they reduce the concern that the activity result is only an artifact of diffuse ZCTA allocation.
The second sensitivity check concerns threshold dependence. The P-G-A classification was recalculated across retained path-length cutoffs of 20, 25, 30, and 33 percent and activity-share cutoffs of 0.45, 0.50, 0.55, and 0.60. Across the 16 combinations, the activity-led share ranges from 41.4 percent to 73.7 percent and the retained/stable share ranges from 25.0 percent to 50.0 percent. This is a real sensitivity, not a nuisance detail. The robust statement is that activity-profile movement and retained/stable histories remain the two dominant families across plausible cutoffs, while their exact shares should not be treated as natural constants.
The third sensitivity check asks whether bundled P-G-A context improves held-out prediction over physical-only baselines. The outcomes are shares or share-like differences on a 0-1 scale, so the RMSE changes are small in absolute units but still interpretable as percentage improvements over the baseline error. In county-blocked high-coverage checks, bundled signatures improve RMSE for the persistence-reproduction gap by 0.0174, about 2.8 percent, and for persistence share by 0.0165, about 3.2 percent. Reproduction alignment does not improve. In the stricter activity-geography valid-built-maturity frame, direct-gap predictive gains are not positive. The predictive evidence therefore strengthens the paper only in a bounded way: it shows modest incremental information from group and formal-establishment context in some high-coverage retention/gap comparisons, but it does not support a broad claim that full signatures universally outpredict physical form.
Table 5. Main Measurement and Prediction Checks
| Vulnerability | Check | Result | Interpretation |
|---|---|---|---|
| Activity movement could be a ZCTA allocation artifact. | Compare trajectory shares across activity-geography quality groups and rerun selected checks in a strict support frame. | Activity-led shares are similar across quality groups; strict frame has 1,949 rows across 276 CBSAs with median total and largest-ZCTA support both 100.0 percent. | Activity can be used as a formal-establishment proxy, but not as building-level or informal activity observation. |
| Typology could depend on arbitrary thresholds. | Recalculate retained and activity-led shares across retained cutoffs of 20-33 percent and activity-share cutoffs of 0.45-0.60. | Activity-led share ranges from 41.4 to 73.7 percent; retained/stable share ranges from 25.0 to 50.0 percent. | Dominant family ordering is robust, but exact shares are threshold-dependent. |
| Bundled P-G-A context might add no independent information. | Compare held-out prediction against physical-only baselines. | High-coverage county-blocked RMSE gains are 0.0174 for the persistence-reproduction gap and 0.0165 for persistence share; reproduction alignment and strict direct-gap prediction are not positive. | Predictive increment is modest and conditional, so prediction is a sensitivity check rather than a central validation claim. |
4.7 A Failed Selection Claim: Activity Saturation Does Not Broadly Predict Substitution
The final test examines a more specific selection claim: saturated activity packages should weaken same-form reproduction and select substitutes or hybrid forms. Saturation means prior formal-establishment concentration or density in the observed activity profile. A substitute outcome means later movement away from the prior activity package rather than reproduction of that package. A hybrid outcome means a later package that combines inherited and alternative activity patterns rather than simply repeating or replacing the prior form. The intuition is plausible: where an activity profile is already dense or saturated, later development might be more likely to shift into substitute or hybrid forms rather than reproduce the same package. The observable implication is a positive association between activity saturation and substitute or hybrid outcomes after the relevant physical-pathway context is included.
The results do not support that broad implication. In the tract transition design using 1,995 transitions across 146 CBSAs, the coefficient for saturation on the substitute outcome is negative, -0.304, with p = 0.006. For the broader substitute-or-hybrid outcome, the coefficient is -0.052 with p = 0.534. The observed share of substitute-or-hybrid outcomes falls from 0.434 in the first saturation quartile to 0.345 in the fourth quartile. In the industry-code-consistent trajectory specification, which avoids comparisons across incompatible SIC and NAICS periods, the saturation coefficient is 0.070 with p = 0.737, while inherited physical pathway structure is far more predictive. An alternative competing specification gives a similarly null saturation estimate, 0.057 with p = 0.612.
Table 6. Activity Saturation and Substitute/Hybrid Outcomes
| Test frame | Sample | Saturation estimate | Physical-pathway estimate | Result |
|---|---|---|---|---|
| Direct transition | 1,995 transitions; 146 CBSAs | Substitute: -0.304, p = 0.006; substitute-or-hybrid: -0.052, p = 0.534 | Not focal in this summary | No broad positive saturation effect. |
| Industry-code-consistent | 2,083 rows; 368 CBSAs | 0.070, p = 0.737 | Base connector: -1.082, p < 0.001 | Physical pathway dominates saturation. |
| Alternative specification | 2,085 rows; 369 CBSAs | 0.057, p = 0.612 | Base connector share: 0.371, p < 0.001 | Null saturation result persists. |
The saturation claim is therefore not supported as a general mechanism in these data. Saturation may still matter in narrower activity families, in specific regulatory environments, or at building, parcel, or corridor scales that this paper cannot observe. The broad claim that formal-establishment saturation selects substitute or hybrid tract outcomes is not sustained by the tract-level tests, so the mechanism requires narrower formulation before it can function as an empirical selection claim.
5. Discussion
The analysis supports the value of TUEM as a claim-generating model while narrowing several of its claims. The main lesson is that trajectory classification provides a tractable operationalization and a way to learn from proxies, not a full validation of the model. Physical road histories can be grouped into meaningful terrain families, and those terrain families do not determine the whole urban-evolution interpretation. Once group and formal-establishment activity histories are added, outward extensions, subdivision branches, stitched infill, inherited grids, and hybrid terrains cross with retained, activity-profile-moving, group-moving, and coupled paths.
This finding deepens the meaning of the formeme while also disciplining what can be claimed from the data. A formeme is not a road shape with demographic and activity variables appended after the fact. It is a relational unit in which physical organization, activities, and groups jointly define the urban object being compared. The evidence shows why that matters: activity-profile movement on outward extensions, retained/stable packages on outward extensions, and activity-profile movement on stitched infill have different descriptive meanings even when they share parts of the same physical vocabulary. The evidence does not, by itself, show the local mechanisms that produced those histories.
The component-durability findings also refine TUEM. Physical form is often durable, and in the two largest trajectory families the median physical movement share is zero. Durability is nevertheless not a universal hierarchy. Activity and group components can be the principal observed movement in a tract history, and coupled movement appears in smaller families that merit more detailed study. The resulting formulation is conditional: physical form often constrains and carries urban evolution, while the relative pace of P, G, and A depends on pathway, period, measurement cadence, and scale.
The expansion/recombination result gives TUEM a sharper empirical vocabulary for variation. Outward extension, subdivision branching, stitched infill, grid/loop inheritance, and branch-and-stitch hybrids are not merely visual types. They are measurable pathways through which road form is extended, connected, repeated, or recombined. This distinction matters because activity-profile or resident-composition movement can occur within several of those pathways. A tract can change its formal-establishment profile without a large measured road-form movement, and the same physical terrain can carry different group and activity histories. The permutation result keeps this claim at the right level: it supports a descriptive classification of cross-cutting histories, not a strong claim that physical terrain sorts group and activity trajectories.
The unsupported saturation claim is equally important. In a claim-generating model, plausible mechanisms are not confirmed by plausibility alone. The activity-saturation claim is theoretically intelligible, but the broad tests do not show that saturation selects substitute or hybrid tract outcomes. In these data, inherited physical pathway structure is more informative than the broad saturation measure. This result returns a more constrained research question to TUEM: saturation may need to be specified by activity family, spatial scale, regulatory setting, or local market structure before it becomes a testable selection mechanism.
The sensitivity checks also change the weight placed on the evidence. High-coverage and county-level checks support the activity layer as a usable formal-establishment proxy, but they do not validate address-level activity or informal use. Threshold checks show that the broad ordering of activity-profile-moving and retained/stable histories is robust, while exact family shares remain design-dependent. Held-out prediction supplies only modest and inconsistent incremental gains. These results define the paper's inferential contribution: they show where the operationalized claims are robust, bounded, or unsupported. The paper points toward a larger claim space without treating this first operationalization as decisive. TUEM is not a closed list of hypotheses. It is a way to generate claims from a formal language of physical organization, group context, activity content, signature distance, trajectory, selection, retention, recoding, and scale. A mature empirical program can systematically explore the possibility space allowed by TUEM's formal structure.
6. Limitations and Future Directions
The tests in this paper are necessarily proxy-based. That is not unusual in urban research, where physical form, activity, and social composition are observed through different institutions and at different spatial and temporal resolutions. In this design, proxy use is also part of the object of inquiry: the paper asks what happens when TUEM concepts are forced into available empirical traces. The results should therefore be read as tests of observable traces of TUEM signatures, not as direct observation of complete formemes. The physical component is strongest for road networks and built timing, but it does not fully observe parcels, buildings, zoning, transit, utilities, ownership, infrastructure quality, or design form. The group component describes residents better than all users, workers, owners, visitors, institutions, or political actors. The activity component describes formal establishments better than informal work, household routines, visitor activity, online activity, institutional practice, or the meanings attached to places by users.
The activity layer deserves special caution because it carries much of the empirical movement in the main typology. ZBP and CBP provide unusually broad repeated evidence on formal establishments, and the paper reports tract-ZCTA support and county and metropolitan validation checks. Those checks make the activity proxy usable, but they do not remove every ecological and scale problem. ZIP and ZCTA geographies are not tract geographies, and strong county or CBSA agreement does not prove that every tract-level activity profile is observed without error. Future work should validate the activity component against independent local land-use, parcel, licensing, employment, mobility, or establishment-register data in selected metropolitan areas.
The paper's strongest supported claims are classification and measurement claims. Road histories form meaningful terrain families; P-G-A movement histories distinguish retained, activity-led, group-led, physical-led, and coupled paths; and the crossed typology shows why physical terrain alone is incomplete. These results are useful, but they should not be mistaken for causal identification. Some findings also depend on the construction of the typology. For example, activity-profile movement is defined from component movement shares, and the recoding interpretation then rests on reading that classification against stable physical containers. The paper therefore treats recoding as a bounded association between low measured physical movement and higher measured group or establishment-profile movement, not as proof of the mechanisms that produced reuse.
Measurement cadence is another limit. Roads and built maturity are slow-moving and partly historical; census and ACS data are periodic; ZBP is annual only from 1994 onward. These differences can make physical form appear more durable and activity more mobile. The robustness checks show that the broad activity-led and retained/stable distinction survives several threshold choices, but the exact family shares remain threshold-dependent. Future work should test the same claims in designs where physical, social, and activity observations are more closely synchronized, and should report classification uncertainty around each trajectory family rather than treating the preferred labels as fixed natural kinds.
The same-terrain result is intentionally modest. The crossed typology shows that the same road terrain can appear with different group and activity histories, but the shuffled-context check does not support a strong terrain-to-context sorting mechanism. That result is still useful because it prevents a physical-only interpretation of urban evolution, but it is not evidence that particular terrains systematically select particular group or activity trajectories. A stronger test would need predictive or out-of-sample designs: for example, asking whether road terrain improves prediction of future activity or group movement after baseline metropolitan context, prior activity mix, and tract social composition are included.
Several extensions follow directly from these limits. First, richer parcel, building, zoning, transit, ownership, tax-assessment, business-license, and mobility data would allow more direct tests of physical and regulatory mechanisms. Second, saturation and substitution should be tested within specific activity families and institutional settings rather than through one broad formal-establishment saturation measure. Third, rare coupled and physically led trajectories require finer lineage studies because national tract counts are too small for stable family-level interpretation. Fourth, selected case validations could compare the typology against known redevelopment corridors, industrial conversions, commercial suburbanization, or downtown reinvestment episodes. Fifth, comparative datasets outside the United States would show whether similar observable-implication tests hold under different planning regimes, property systems, and urban histories.
These directions preserve the main lesson of the paper. TUEM is most useful when it disciplines empirical work: define the model claim, specify the observable implication, measure the available traces, test the pattern, and then narrow or reject claims that the data do not support. Proxies do not make such tests invalid; they make the scope of inference explicit. The next stage is to join the broad national evidence used here with deeper local evidence that can test the mechanisms behind the classifications.
7. Conclusion
This paper operationalized central features of the Toronto Urban Evolution Model by translating them into observable claims about signatures and trajectories. The main evidence came from linked physical, group, and formal-establishment activity records for U.S. census tracts and metropolitan areas. The analysis asked whether present physical form is enough to classify urban evolution, whether components differ in relative durability, whether expansion and recombination are distinct pathways, whether similar physical terrains can carry different group and activity histories, whether stable physical containers are paired with activity-profile or resident-composition movement, and whether activity saturation selects substitute or hybrid outcomes.
The results support a trajectory-centered descriptive interpretation. Road histories form recurrent terrain families, but those physical pathways are crossed by different group and activity histories. Activity-profile movement is widespread across several physical terrains; retained/stable pathways are visible but not identical to full signature immobility; group-led and coupled movement appear as smaller families; and stable physical containers can carry changed formal-establishment profiles. The same-terrain result is descriptive rather than a strong sorting-mechanism finding. Physical form is often durable, but its durability is conditional. Activity-proxy and threshold checks strengthen the measurement case while confirming that exact family shares and predictive gains remain bounded. The broad saturation-to-substitution claim is not supported.
The paper's larger claim is that TUEM becomes scientifically useful when it is treated as a claim-generating model whose claims can fail, narrow, or become merely descriptive under available evidence. Its concepts make empirical demands: define the formeme, measure the signature, classify the trajectory, specify the observable implication, distinguish classification from validation, and accept narrowing or rejection when the evidence requires it. That discipline is what allows urban evolution to be studied neither as a loose metaphor nor as a physical morphology alone, but as a linked history of material form, groups, and activities. The contribution is to make that chain explicit: model terms are translated into proxies, tested against observable patterns, and narrowed when the evidence requires it.
Appendix A. Claim Sequence Used in the Main Text
This appendix restates the paper's main claim sequence in compact form. The claims are the ones that the linked road, resident-composition, and formal-establishment evidence can evaluate directly in this manuscript.
| Claim | Evidence type | Theory claim | Observable implication | Result |
|---|---|---|---|---|
| Trajectory classification | Constructed classification | Places with similar present signatures can have different evolutionary meanings. | Road histories should form recurrent trajectory families that are not reducible to one present-morphology continuum. | Supported as a road-history classification, not as independent mechanism validation. |
| Conditional component durability | Descriptive empirical pattern | Physical form is durable but partial. | Physical movement should often be lower than group or activity movement, but the test allows the slowest component to vary by pathway and window. | Narrowed: physical form is often stable, but no universal slowest-component law is supported. |
| Expansion versus recombination | Constructed classification | Road connector/infill synthesis differs from terminal or outward expansion. | Outward extension, subdivision branching, stitched infill, inherited connected layouts, and hybrid cases should have different road-terrain profiles. | Supported as a terrain classification: outward extension, stitched infill, subdivision branching, and hybrid paths are empirically separable. |
| Same terrain, different bundled histories | Descriptive classification plus null benchmark | Similar physical forms can be paired with different observed group and activity histories. | A physical terrain family should appear with more than one P-G-A movement history, while a sorting claim would require association beyond shuffled context. | Supported only as descriptive classification: permutation checks do not support a stronger terrain-to-context sorting claim. |
| Stable containers with activity-profile movement | Descriptive association and construct-validity target | Existing physical form can restrict change, absorb new group/activity patterns, or become decoupled from changing G/A. | Stable or low-moving road containers should sometimes be paired with substantial group or activity movement. | Supported with scope limits: activity-profile movement through stable road containers is recurrent, but mechanisms such as zoning, ownership, and building-level reuse are not directly observed. |
| Activity saturation and substitution | Mechanism-like selection test | Saturated activity packages should weaken same-form reproduction and select substitute or hybrid forms. | Activity saturation should be positively associated with substitute or hybrid outcomes after physical-pathway context is included. | Not supported as a broad mechanism: saturation coefficients are null or contrary, while physical pathway context is more predictive. |
The sequence keeps the paper's empirical burden clear: classify trajectories; compare component movement; distinguish physical pathways; cross physical pathways with group and activity histories; interpret possible recoding within stable containers only as a bounded trace; and test a more specific selection claim that fails under the observed design.
Appendix B. Activity Proxy and Alignment Support
The activity layer is built from ZIP Code Business Patterns (ZBP) and County Business Patterns (CBP), which observe formal establishments and employment by industry. These records are used because TUEM requires an activity component and because federal business registers provide repeated, comparable, geographically linkable observations of establishment activity. The measure does not observe informal work, household routines, visitor behavior, online activity, institutional practice outside establishment records, or the meaning that users attach to places.
At the tract-ZCTA level, the annual panel covers 1994-2023. Median high-coverage tract-year support is 95.9 percent, and median high-or-usable support is 97.7 percent. In the tract allocation used for the analysis, 97.0 percent of tract-ZCTA records have at least 95 percent areal support, with a median largest single-ZCTA share of 96.9 percent. These figures indicate that most tract records are linked to a dominant ZCTA geography rather than being assembled from highly diffuse overlaps.
County and metropolitan checks compare constructed activity-family profiles against CBP records at coarser geographies where direct federal records are available. The CBSA validation includes 391 metropolitan or micropolitan records. Weighted correlations are 0.981 for the local-service profile, 0.958 for the production/distribution profile, 0.977 for the office profile, and 0.941 for activity entropy. The county validation includes 3,129 matched counties for profile measures and 606 retention-frame counties. In the retention frame, weighted correlations are 0.986 for the local-service profile, 0.973 for the production/distribution profile, 0.985 for the office profile, and 0.938 for activity entropy.
Table B1. Activity-Proxy Validation Summary
| Validation check | Sample | Main readout | Interpretation |
|---|---|---|---|
| Annual tract-ZCTA panel | 1994-2023; median 16,807 tracts and 401 CBSAs per year | Median high-coverage share 95.9%; median high-or-usable share 97.7% | The annual activity panel has broad coverage across the tract frame. |
| Tract-ZCTA areal support | 16,808 tracts; 401 CBSAs | 97.0% of records have at least 95% areal support; median largest ZCTA share 96.9% | Most tract activity allocations are not highly fragmented across ZCTAs. |
| CBSA profile validation | 391 CBSAs | Weighted correlations 0.941-0.981 for main profile and entropy measures | Constructed CBSA activity profiles align closely with CBP benchmarks. |
| County profile validation | 3,129 matched counties | Weighted correlations 0.923-0.991 for main profile and entropy measures | County comparisons support the activity-family construction. |
| Retention-frame county validation | 606 counties | Weighted correlations 0.938-0.986 for local-service, production/distribution, office, and entropy profiles | The subset used for retention-related checks retains strong activity-profile alignment. |
The paper therefore uses activity claims with three restrictions. First, activity means formal-establishment activity unless otherwise specified. Second, local annual activity timing begins in 1994, so earlier local activity claims are not inferred from ZBP. Third, activity movement is interpreted at the scale of the available crosswalk, not as a direct observation of building-level use.
Appendix C. Trajectory Construction and Classification
The trajectory-terrain analysis uses 16,808 tract histories across 401 CBSAs. Its source records are a tract signature panel, a longitudinal P-G-A distance panel, and a multiyear tract-ZCTA activity panel. The physical terrain classification is built from road-history measures that describe how new road length relates to the prior network: branch share, strict subdivision-style branching, connector/infill stitching, outward extension, and inherited grid or loop structure.
A physical terrain family is an empirical summary of road-building history. The inputs are road-kilometer-weighted measures: branch_share is the broad terminal or branching share; strict_subdivision_share is the short-terminal subdivision proxy; stitching_share is the connector and infill share; outward_share is the clipped sum of edge extension and isolated leapfrog share; grid_fragment_share is the grid-fragment proxy; and loop_mesh_share is the loop or mesh proxy. The classification rule is:
if branch_share >= 0.58 and strict_subdivision_share >= 0.10:
    terrain_family = "Subdivision branches"
else if stitching_share >= 0.72 and branch_share < 0.55:
    terrain_family = "Stitched infill"
else if outward_share >= 0.55 and stitching_share < 0.55:
    terrain_family = "Outward extensions"
else if grid_fragment_share >= 0.30 and loop_mesh_share >= 0.45:
    terrain_family = "Grid/loop inheritance"
else if branch_share >= 0.55 and stitching_share >= 0.60:
    terrain_family = "Branch-and-stitch hybrids"
else:
    terrain_family = "Mixed incremental change"
The families therefore describe observed road-network pathways rather than neighborhood types. Outward extensions have high outward shares. Stitched infill has high connector/infill shares. Subdivision branches have high branch shares and subdivision-style terminal structure. Grid/loop inheritance identifies connected layouts that persist or recur. Branch-and-stitch hybrids combine substantial branching with substantial later stitching. Mixed incremental change identifies tracts without one dominant road-building form.
P-G-A movement families are constructed after physical, group, and activity distances are aligned within a comparison frame. The generic component-share calculation is:
P_share_i = P_distance_i / (P_distance_i + G_distance_i + A_distance_i)
G_share_i = G_distance_i / (P_distance_i + G_distance_i + A_distance_i)
A_share_i = A_distance_i / (P_distance_i + G_distance_i + A_distance_i)
where the distances are scaled within the relevant comparison frame before shares are interpreted. Retained/stable classification uses total path length as well as component shares. A retained/stable row can therefore have a high activity share if the total movement path is short. In the main results, retained/stable rows have a median path length of 0.044, compared with 0.076 for the activity-led category.
The component-family rule is:
total_component_path_i = P_distance_i + G_distance_i + A_distance_i
P_share_i = P_distance_i / total_component_path_i
G_share_i = G_distance_i / total_component_path_i
A_share_i = A_distance_i / total_component_path_i
suddenness_i = maximum single-period step_i / total signature path_i
path_intensity_i = quartile(total signature path_i)

if total signature path_i <= 25th percentile:
    movement_family = "retained/stable"
else if A_share_i >= 0.50:
    movement_family = "A-led activity movement"
else if P_share_i >= 0.50:
    movement_family = "P-led physical movement"
else if G_share_i >= 0.50:
    movement_family = "G-led group movement"
else if P_share_i >= 0.25 and A_share_i >= 0.25 and G_share_i >= 0.20:
    movement_family = "bundled P-G-A movement"
else if P_share_i >= 0.30 and A_share_i >= 0.30:
    movement_family = "P-A coupled movement"
else if G_share_i >= 0.30 and A_share_i >= 0.30:
    movement_family = "G-A coupled movement"
else if P_share_i >= 0.30 and G_share_i >= 0.30:
    movement_family = "P-G coupled movement"
else:
    movement_family = "mixed component movement"
The retained/stable rule is evaluated before component-dominance rules, so tracts with short total paths are not classified as activity-led or group-led only because one component has a large share of a very small denominator. The suddenness and path-intensity measures describe trajectory shape and magnitude; they are not used to change the family labels in the main typology.
The classification is descriptive rather than causal. It states which observed component accounts for most measured movement, not why that movement occurred. For example, the activity-led category identifies tract histories in which formal-establishment activity moves more than road form or resident composition. It does not assert that establishments caused the road container to persist.
Table C1. Main Trajectory Classification Ingredients
| Classification object | Unit | Main ingredients | Reader interpretation |
|---|---|---|---|
| Physical terrain family | Tract history | Branch share, strict subdivision share, connector/infill share, outward share, grid/loop inheritance | Describes how the road network changed. |
| P-G-A movement family | Tract history with aligned components | Scaled physical, group, and activity distances; total path length | Describes which part of the observed signature moved most. |
| Rich trajectory type | Tract history | Physical terrain family crossed with P-G-A movement family | Describes how road history and signature movement combine. |
| Vignette lineage | Selected tract | Sequence of P-G-A states and component-dominant segments | Shows how the typology appears in concrete places. |
Appendix D. Robustness and Sensitivity Checks
The robustness checks are designed around the claims made in the main text. They do not convert the paper into a causal design. They ask whether the descriptive classifications and evidentiary conclusions are fragile to obvious measurement objections.
The first check concerns conditional component durability. Raw distances make physical form appear slowest in 69.7 percent of rows, while group context is slowest in 11.0 percent and activity in 19.3 percent. After standardized calibration, the slowest-component shares become more balanced: physical form 37.9 percent, group context 28.6 percent, and activity 33.5 percent. This is why the main text reports physical durability as real but not universal. Direct physical-persistence checks point in the same direction: in lineage states, median relative road-kilometer change is 0.15 percent, 83.7 percent of cases have road-kilometer change under 5 percent, and connector, loop, and grid shares are all under 5 percentage-point change in the checked cases.
The second check concerns threshold sensitivity. The trajectory classifications were recalculated across retained path-length cutoffs of 20, 25, 30, and 33 percent and activity-led share cutoffs of 0.45, 0.50, 0.55, and 0.60. Across the 16 combinations, the activity-led share ranges from 41.4 percent to 73.7 percent and the retained/stable share ranges from 25.0 percent to 50.0 percent. The broad conclusion is stable: activity-led and retained/stable pathways remain the two dominant families, although their exact shares depend on the chosen cutoffs. This supports the qualitative classification while preventing the paper from treating one threshold as a natural law.
The third check concerns same-terrain classification. If physical terrain alone organized the bundled history, most observations within a physical cluster would fall into the same P-G-A movement family. The observed off-dominant share is 51.7 percent, meaning that just over half of observations fall outside the dominant bundled family for their physical cluster. A shuffled-context null gives an off-dominant share of 53.1 percent, normalized mutual information of 0.399, and variation of information of 2.860, compared with observed values of 0.427 and 2.720. The observed classification therefore shows cross-cutting histories, but it does not exceed the shuffled baseline enough to support a strong terrain-to-context sorting claim. This is why the same-terrain result is reported as descriptive classification evidence rather than as an independent mechanism test.
The fourth check concerns ZCTA activity-geography quality. Trajectory classification shares are similar across high-coverage and lower-coverage tract-ZCTA groups. High-coverage cases have an activity-led share of 74.1 percent and a retained/stable share of 23.6 percent. Lower-coverage cases have an activity-led share of 74.7 percent and a retained/stable share of 22.4 percent. Coverage-unavailable cases have an activity-led share of 71.7 percent and a retained/stable share of 25.8 percent. The main trajectory distinction is therefore not driven only by the highest-coverage ZCTA matches.
The fifth check uses a stricter activity-geography support frame. This frame requires median tract-ZCTA area coverage of at least 0.95, total tract-area coverage of at least 0.95, and largest single-ZCTA overlap of at least 0.90. It contains 1,949 rows across 276 CBSAs, equal to 29.7 percent of high-activity-coverage rows, with median tract-area coverage and median largest single-ZCTA support both at 100.0 percent. In that strict frame, common-frame retention models still show positive base-connector estimates for persistence share, reproduction alignment, and the persistence-reproduction gap, but held-out predictive increments are not consistently positive. This supports activity matching as usable for formal-establishment profiles while preventing the paper from using prediction as a central validation claim.
The sixth check asks whether P-G-A context improves held-out prediction over physical-only baselines. In county-blocked high-coverage checks, bundled signatures improve RMSE for persistence share by 0.0165, about 3.2 percent, and for the persistence-reproduction gap by 0.0174, about 2.8 percent; reproduction alignment does not improve. In direct-gap checks using stricter activity geography and valid built-maturity rows, predictive gains are not positive. The implication is that bundled P-G-A context contains some incremental information in selected high-coverage retention/gap comparisons, but the paper should not claim universal out-of-sample superiority over physical form.
Table D1. Robustness Summary for the Main Trajectory Claims
| Issue | Check | Main result | Implication for the paper |
|---|---|---|---|
| Component pace scale | Raw and standardized slowest-component shares | Raw physical-slowest share 69.7%; standardized physical-slowest share 37.9% | Component durability is stated conditionally, not as a universal physical-slowest law. |
| Direct physical persistence | Road-kilometer and connector/grid/loop stability | Median relative road-km change 0.15%; 83.7% under 5% road-km change | Physical persistence is visible in direct road measures. |
| Trajectory thresholds | Retained cutoffs 0.20-0.33; activity-led cutoffs 0.45-0.60 | Activity-led and retained/stable remain dominant, but shares vary by cutoff | The typology is useful, but exact family shares are threshold-dependent. |
| Same-terrain classification | Shuffled-context permutation check | Observed off-dominant share 51.7%; null 53.1%; observed NMI 0.427; null NMI 0.399 | The same-terrain result is descriptive classification evidence, not a strong sorting-mechanism result. |
| Activity-geography quality | High-coverage versus lower-coverage ZCTA support | Activity-led share 74.1% in high-coverage cases and 74.7% in lower-coverage cases | Main trajectory classification is not confined to the cleanest activity-geography matches. |
| Strict activity geography | Total tract-area coverage >= 0.95 and largest single-ZCTA support >= 0.90 | 1,949 rows across 276 CBSAs; median total and largest-ZCTA support both 100.0% | Activity matching can be defended as a formal-establishment proxy, but not as building-level activity observation. |
| Held-out prediction | County-blocked and CBSA-blocked comparisons against physical-only baselines | High-coverage county-blocked RMSE gains are modest for persistence share and persistence-reproduction gap; strict direct-gap prediction is not positive | Prediction is a sensitivity check, not a central validation claim. |
Appendix E. Activity Saturation Models
The saturation models test whether saturated activity packages select substitute or hybrid forms. The claim expects saturation to be positively associated with substitute or hybrid outcomes after relevant physical-pathway context is included. In simplified form, the model is:
$$\text{Substitute\_or\_hybrid}_i = \alpha + \beta_1 \, \text{saturation}_i + \beta_2 \, \text{physical\_pathway}_i + \gamma X_i + \epsilon_i$$
where saturation_i measures prior formal-establishment saturation, physical_pathway_i records inherited road-pathway context, and X_i contains the additional covariates used in the relevant specification. The claim expects beta_1 > 0. Across the direct transition design, the industry-code-consistent specification, and the alternative competing specification, beta_1 is null or contrary. The result is therefore classified as unsupported rather than weakly supported.
Table E1. Activity Saturation and Substitute/Hybrid Outcomes
| Test frame | Sample | Saturation estimate | Physical-pathway estimate | Result |
|---|---|---|---|---|
| Direct transition | 1,995 transitions; 146 CBSAs | Substitute: -0.304, p = 0.006; substitute-or-hybrid: -0.052, p = 0.534 | Not focal in this summary | No broad positive saturation effect. |
| Industry-code-consistent | 2,083 rows; 368 CBSAs | 0.070, p = 0.737 | Base connector: -1.082, p < 0.001 | Physical pathway dominates saturation. |
| Alternative specification | 2,085 rows; 369 CBSAs | 0.057, p = 0.612 | Base connector share: 0.371, p < 0.001 | Null saturation result persists. |
The negative or null saturation coefficients do not imply that saturation is irrelevant in every urban context. They show that the broad tract-level formal-establishment saturation measure does not select substitute or hybrid outcomes in the tested designs. Future tests should specify saturation by activity family, spatial scale, regulatory environment, and building or parcel context.
The model information needed to evaluate this negative result is summarized here because the selection claim is the most mechanism-like test in the paper. The direct-transition frame uses eligible tract transitions with complete saturation, outcome, and physical-pathway information. The industry-code-consistent frame restricts the comparison to rows that avoid mixing incompatible SIC and NAICS periods. The alternative specification keeps the same broad selection question but changes the physical-pathway control from categorical connector context to a continuous base-connector-share specification. All three tests evaluate whether the saturation coefficient is positive after physical-pathway context is included; none provides that support.
Table E2. Saturation Model Specification Summary
| Test frame | Outcome | Estimator | Key predictors | Sample rule | Inference readout |
|---|---|---|---|---|---|
| Direct transition | Substitute outcome; substitute-or-hybrid outcome | Regression model for tract transition outcome | Prior formal-establishment saturation and transition/pathway context | Complete eligible direct transitions with observed prior saturation and later outcome; 1,995 transitions across 146 CBSAs | Saturation is negative for substitute and null for substitute-or-hybrid. |
| Industry-code-consistent | Substitute-or-hybrid outcome | Regression model for trajectory row outcome | Prior formal-establishment saturation and inherited physical pathway, including base connector | Rows that avoid SIC/NAICS period mixing; 2,083 rows across 368 CBSAs | Saturation is null; base connector is strongly associated with the outcome. |
| Alternative specification | Substitute-or-hybrid outcome | Rival regression specification | Prior formal-establishment saturation and base connector share | Alternative complete frame; 2,085 rows across 369 CBSAs | Saturation is null; base connector share remains predictive. |
The table does not make the saturation analysis causal. It clarifies the estimand and sample restrictions behind the reported negative result. A stronger future test would add spatially explicit controls, regulatory and parcel covariates, and standard errors clustered by metropolitan system or another defensible dependence structure.
Appendix F. Evidence Sources for Figures and Tables
This appendix identifies the evidence sources that support the main displays and appendix claims. The supplementary manifest lists the source files and checksums. This appendix summarizes which sources support each main figure, table, and appendix claim.
- Figure 1 and Table 2 use the terrain-family summary and the physical-terrain figure to support the physical-terrain counts and definitions used for trajectory classification and the expansion/recombination distinction.
- Figure 2 and Table 3 use the P-G-A trajectory-family profile summary and the P-G-A family count figure to support the component-movement counts used for conditional durability and trajectory classification.
- Figure 3 uses the component-movement profile figure to show median P, G, and A movement shares by P-G-A family for the conditional durability claim.
- Figure 4 uses the road-terrain mix figure to show how physical terrain varies across P-G-A movement families for the expansion/recombination claim.
- Figure 5 and Table 4 use the rich-trajectory type summary and rich-trajectory count figure to support the crossed physical-terrain and P-G-A histories used for the same-terrain claim.
- Figure 6 uses the lineage-state, segment, and component-movement summaries to support the place-based lineage examples used for the stable-container and activity-profile movement claim.
- Table 6 and Appendix E use the direct-transition and industry-code-consistent trajectory summaries to support the unsupported saturation-to-substitution claim.
- Appendix B uses ZBP annual coverage, tract-ZCTA support, CBSA validation, and county validation summaries to support activity-proxy scope and alignment.
- Appendix D uses component-pace, direct physical-persistence, trajectory-threshold, same-terrain permutation, and ZCTA-quality summaries to support conditional durability, same-terrain classification, and trajectory classification.
Data and Materials Availability
A curated reproducibility package accompanies this manuscript as supplementary material. The package includes derived analytical inputs, reproduction scripts, source-data documentation, reference results, and a file manifest with checksums. It is designed to support evaluation of the manuscript figures, tables, statistical summaries, and appendix results from cleaned and derived files. It does not rebuild every upstream raw-data extraction from the original public sources. Raw source datasets are documented in the source-data manifest, including CHRONEX-US, LTDB, Census/ACS, ZIP Code Business Patterns, County Business Patterns, TIGER tract/ZCTA boundaries, and their access conditions.
References
- Batty, Michael. 2007. Cities and Complexity: Understanding Cities with Cellular Automata, Agent-Based Models, and Fractals. Cambridge, MA: MIT Press.
- Batty, Michael. 2008. "The Size, Scale, and Shape of Cities." Science 319 (5864): 769-771. https://doi.org/10.1126/science.1151419.
- Bettencourt, Luis M. A. 2013. "The Origins of Scaling in Cities." Science 340 (6139): 1438-1441. https://doi.org/10.1126/science.1235823.
- Bettencourt, Luis M. A., Jose Lobo, Dirk Helbing, Christian Kuhnert, and Geoffrey B. West. 2007. "Growth, Innovation, Scaling, and the Pace of Life in Cities." Proceedings of the National Academy of Sciences of the United States of America 104 (17): 7301-7306. https://doi.org/10.1073/pnas.0610172104.
- Blute, Marion. 2010. Darwinian Sociocultural Evolution: Solutions to Dilemmas in Cultural and Social Theory. Cambridge: Cambridge University Press. https://doi.org/10.1017/CBO9780511804755.
- Boeing, Geoff. 2019. "Urban Spatial Order: Street Network Orientation, Configuration, and Entropy." Applied Network Science 4 (1): 67. https://doi.org/10.1007/s41109-019-0189-1.
- Brown, Robert. 2013. Explanation in Social Science. Abingdon, UK: Routledge. Originally published 1963.
- Dawkins, Richard. 1982. "Replicators and Vehicles." In Current Problems in Sociobiology, edited by King's College Sociobiology Group, 45-64. Cambridge: Cambridge University Press.
- Delmelle, Elizabeth C. 2016. "Mapping the DNA of Urban Neighborhoods: Clustering Longitudinal Sequences of Neighborhood Socioeconomic Change." Annals of the American Association of Geographers 106 (1): 36-56. https://doi.org/10.1080/00045608.2015.1096188.
- Duranton, Gilles, and Diego Puga. 2001. "Nursery Cities: Urban Diversity, Process Innovation, and the Life Cycle of Products." American Economic Review 91 (5): 1454-1477. https://doi.org/10.1257/aer.91.5.1454.
- Fischer, Claude S. 1975. "Toward a Subcultural Theory of Urbanism." American Journal of Sociology 80 (6): 1319-1341. https://doi.org/10.1086/225993.
- Fox, Mark S., Daniel Silver, and Patrick Adler. 2022. "Towards a Model of Urban Evolution: Part II: Formal Model." Urban Science 6 (4): 88. https://doi.org/10.3390/urbansci6040088.
- Fox, Mark S., Daniel Silver, Thiago Silva, and Xinyi Zhang. 2022. "Towards a Model of Urban Evolution Part IV: Evolutionary (Formetic) Distance - An Interpretation of Yelp Review Data." Urban Science 6 (4): 86. https://doi.org/10.3390/urbansci6040086.
- Hull, David L. 1981. "Units of Evolution: A Metaphysical Essay." In The Philosophy of Evolution, edited by U. J. Jensen and R. Harre, 23-44. Brighton: Harvester Press.
- Jacobs, Jane. 1969. The Economy of Cities. New York: Random House.
- Logan, John R., Zengwang Xu, and Brian J. Stults. 2014. "Interpolating U.S. Decennial Census Tract Data from as Early as 1970 to 2010: A Longitudinal Tract Database." Professional Geographer 66 (3): 412-420. https://doi.org/10.1080/00330124.2014.905156.
- Marshall, Stephen. 2009. Cities Design and Evolution. Abingdon, UK: Routledge.
- Mehmood, Abid. 2010. "On the History and Potentials of Evolutionary Metaphors in Urban Planning." Planning Theory 9 (1): 63-87. https://doi.org/10.1177/1473095209346495.
- Mesoudi, Alex, Andrew Whiten, and Kevin N. Laland. 2004. "Perspective: Is Human Cultural Evolution Darwinian? Evidence Reviewed from the Perspective of The Origin of Species." Evolution 58 (1): 1-11. https://doi.org/10.1111/j.0014-3820.2004.tb01568.x.
- Portugali, Juval. 2000. Self-Organization and the City. Berlin: Springer. https://doi.org/10.1007/978-3-662-04099-7.
- Portugali, Juval. 2012. "Complexity Theories of Cities: Achievements, Criticism and Potentials." In Complexity Theories of Cities Have Come of Age, edited by Juval Portugali, Han Meyer, Egbert Stolk, and Ekim Tan, 47-62. Berlin: Springer. https://doi.org/10.1007/978-3-642-24544-2_4.
- Scheer, Brenda Case. 2017. The Evolution of Urban Form: Typology for Planners and Architects. 1st ed. New York: Routledge. Originally published 2010 by the American Planning Association. https://doi.org/10.4324/9781351179751.
- Silver, Daniel, Patrick Adler, and Mark S. Fox. 2022. "Towards a Model of Urban Evolution: Part I: Context." Urban Science 6 (4): 87. https://doi.org/10.3390/urbansci6040087.
- Silver, Daniel, Mark S. Fox, and Patrick Adler. 2022. "Towards a Model of Urban Evolution: Part III: Rules of Evolution." Urban Science 6 (4): 89. https://doi.org/10.3390/urbansci6040089.
- Sorensen, Andre. 2015. "Taking Path Dependence Seriously: An Historical Institutionalist Research Agenda in Planning History." Planning Perspectives 30 (1): 17-38. https://doi.org/10.1080/02665433.2013.874299.
- Stinchcombe, Arthur L. 1987. Constructing Social Theories. Chicago: University of Chicago Press. Originally published 1968.
- Uhl, Johannes H., Keith A. Burghardt, and Stefan Leyk. 2025. "CHRONEX-US: City-Level Historical Road Network Expansion Dataset for the Conterminous United States." arXiv:2506.16625. https://arxiv.org/abs/2506.16625.
- U.S. Census Bureau. 2024a. "2022 County Business Patterns Now Available." June 27, 2024. https://www.census.gov/newsroom/press-releases/2024/county-business-patterns.html.
- U.S. Census Bureau. 2024b. "County Business Patterns APIs." Accessed May 28, 2026. https://www.census.gov/data/developers/data-sets/cbp-zbp/cbp-api.html.
- Wilkins, John S., and Pierrick Bourrat. 2022. "Replication and Reproduction." In The Stanford Encyclopedia of Philosophy, edited by Edward N. Zalta and Uri Nodelman, Winter 2022 edition. https://plato.stanford.edu/entries/replication/.
- Wilson, Alan. 2008. Urban and Regional Dynamics-3: "DNA" and "Genes" as a Basis for Constructing a Typology of Areas. CASA Working Paper 130. London: Centre for Advanced Spatial Analysis, University College London. https://www.ucl.ac.uk/bartlett/publications/2008/feb/casa-working-paper-130.
No comments yet. Be the first to comment!