This study presents an in-depth comparative analysis of logistic regression (LR) and random forest (RF) classifiers on the Wisconsin Diagnostic Breast Cancer (WDBC) dataset. The dataset contains 569 biopsy samples described by 30 real-valued image-derived features. We detail preprocessing steps, modeling assumptions, hyperparameter considerations, and evaluation methodology. Both classifiers achieve excellent performance on a stratified 80/20 hold-out test split, with ROC-AUC values exceeding 0.99. While random forest achieves slightly higher classification accuracy, logistic regression provides stronger interpretability through explicit coefficient estimates and odds ratios. We analyze performance trade-offs, clinical implications of decision thresholds, and methodological limitations, emphasizing the importance of interpretability, calibration, and validation in medical machine learning applications.
I. Introduction
Breast cancer is one of the most prevalent cancers worldwide and remains a major cause of mortality when not detected early. Accurate classification of tumors as benign or malignant is therefore critical for timely intervention and improved survival outcomes. Machine learning techniques have increasingly been adopted to support diagnostic decision-making by extracting predictive patterns from quantitative imaging features.
Among classification methods, logistic regression remains a foundational model in medical statistics due to its interpretability and well-understood probabilistic framework [4]. Random forests, introduced by Breiman [1], offer powerful nonlinear modeling capacity and often achieve superior predictive accuracy through ensemble averaging. However, they are typically regarded as less interpretable.
In this study, we conduct a detailed comparison of these two approaches on the Wisconsin Diagnostic Breast Cancer dataset [5]. Beyond reporting performance metrics, we examine methodological assumptions, discuss model interpretability and calibration, and evaluate the clinical implications of threshold selection.
II. Dataset and Preprocessing
The Breast Cancer Wisconsin (Diagnostic) dataset consists of 569 samples (357 benign and 212 malignant). Each sample includes 30 numeric features derived from digitized images of fine-needle aspirate (FNA) cell nuclei. These features quantify tumor size, shape, and texture properties, including radius, perimeter, area, smoothness, compactness, concavity, and concave points.
Preprocessing steps include:
1) Removal of the ID column (non-predictive). 2) Encoding malignant tumors as 1 and benign as 0. 3) Stratified 80/20 train-test split to preserve class distribution. 4) Standardization of features for logistic regression (mean 0, variance 1).
Standardization is necessary for logistic regression because coefficient magnitudes depend on feature scaling. In contrast, random forest does not require scaling due to its tree-based structure.
III. Methodology
A. Logistic Regression
Logistic regression models the probability of malignancy as:
$$P(y = 1|x) = \frac{1}{1 + e^{-(w^T x + b)}} \tag{1}$$
Parameters are estimated via maximum likelihood with L2 regularization to reduce overfitting. The regularization term penalizes large coefficients, improving generalization. Logistic regression assumes a linear relationship between predictors and the log-odds of malignancy, an assumption that may be restrictive but enhances interpretability.
Exponentiating coefficients yields odds ratios, allowing clinicians to quantify how unit increases in features (e.g., tumor area) affect malignancy risk.
B. Random Forest
Random forest constructs an ensemble of decision trees trained on bootstrap samples. Each tree is grown using random subsets of features at each split, reducing correlation between trees and lowering variance. Final predictions are obtained via majority voting or probability averaging.
Unlike logistic regression, random forest can capture nonlinear relationships and interactions between features without explicit specification. However, its ensemble nature reduces transparency.
Feature importance is computed using mean decrease in Gini impurity, identifying which features most strongly contribute to classification decisions.
IV. Evaluation Metrics
Performance is evaluated using:
- Accuracy
- Precision (positive predictive value)
- Recall (sensitivity)
- ROC-AUC
In medical diagnostics, recall (sensitivity) is particularly important, as false negatives may delay critical treatment. ROC-AUC provides a threshold-independent measure of separability.
V. Results
On the test set (114 samples), both models achieved excellent performance:
TABLE I — TEST SET PERFORMANCE
| Model | Accuracy | Precision | Recall | ROC-AUC |
|---|---|---|---|---|
| Logistic Regression | 96.49% | 97.50% | 92.86% | 99.60% |
| Random Forest | 97.37% | 100% | 92.86% | 99.29% |
Logistic regression misclassified four cases (three false negatives, one false positive), while random forest misclassified three cases (three false negatives). Both models produced identical sensitivity, suggesting similar detection capacity for malignant cases.
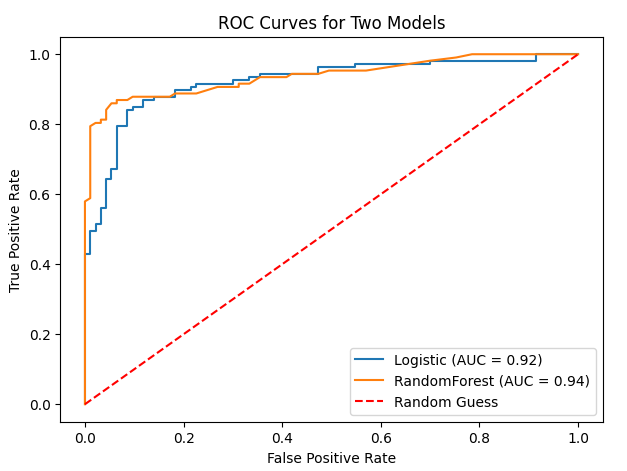 Fig. 1. ROC curves for logistic regression and random forest. Both curves approach the top-left corner, demonstrating near-perfect discrimination.
Figure 1 shows ROC curves for both models. AUC values exceeding 0.99 indicate extremely strong ranking performance. However, AUC does not reflect calibration or the practical choice of decision threshold. Clinically, thresholds may be adjusted to increase sensitivity beyond 93%, accepting additional false positives to minimize missed malignancies.
Feature importance analysis (Figure 2) indicates that size-related and irregularity features (e.g., area_worst, concave points_worst) contribute most strongly. These findings align with pathological understanding: malignant tumors often exhibit larger size and irregular cell boundaries.
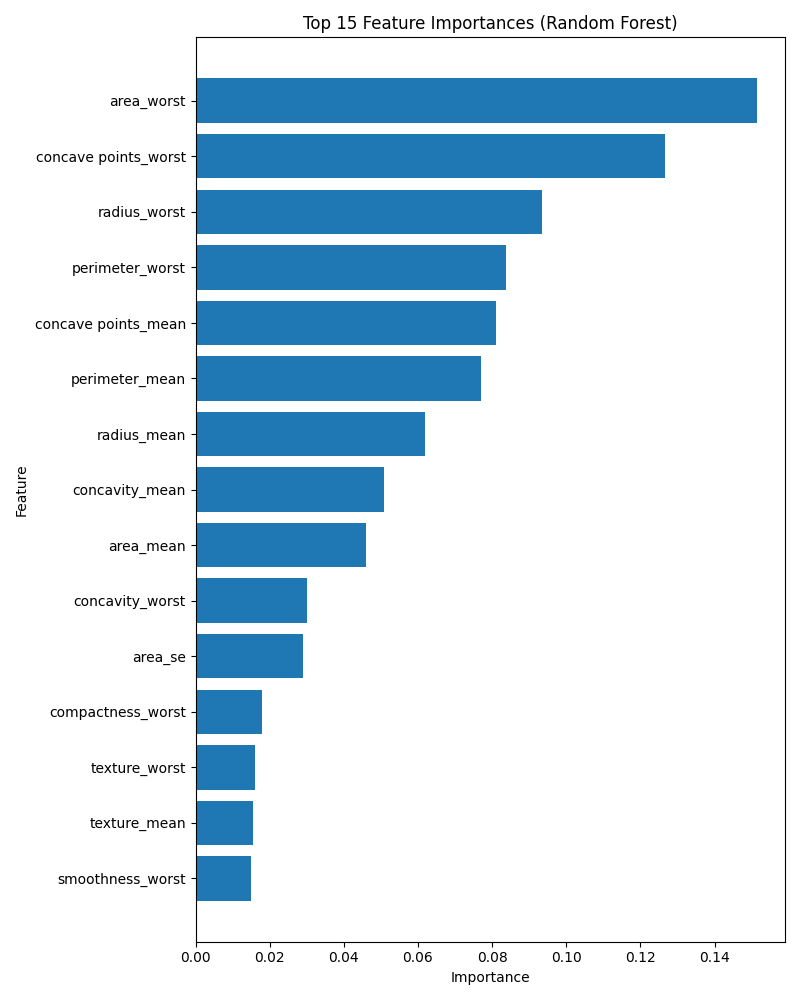 Fig. 2. Random forest feature importance (mean decrease in impurity). Tumor size and irregularity features dominate classification decisions.
VI. Discussion
Although both models perform similarly, important distinctions arise:
A. Interpretability
Logistic regression offers transparent coefficient-based interpretation. Each feature's weight corresponds to a log-odds effect, allowing clinicians to compute odds ratios and assess statistical contribution. This aligns with common medical reporting practices [4].
Random forest, while powerful, functions as a black-box ensemble. Feature importance helps interpretation but does not provide direct effect size estimates.
B. Predictive Capacity
Random forest captures nonlinear relationships and feature interactions that logistic regression may miss. However, the WDBC dataset appears highly linearly separable, explaining why LR performs nearly as well as RF.
C. Clinical Deployment Considerations
In practice, a diagnostic model must balance:
- Sensitivity (avoiding false negatives)
- Specificity (reducing unnecessary anxiety/intervention)
- Calibration (accurate probability estimates)
- Interpretability
While RF achieved perfect precision in this split, both models missed three malignant cases. If higher sensitivity is required, threshold adjustment or class weighting may be applied.
D. Limitations
- Single train-test split may yield optimistic results.
- Small dataset size limits generalization.
- Minimal hyperparameter tuning was performed.
- Real-world clinical data may contain noise and heterogeneity.
Cross-validation, external validation, and calibration analysis would strengthen conclusions.
VII. Conclusion
Both logistic regression and random forest achieve near-perfect classification performance on the Wisconsin Diagnostic Breast Cancer dataset. Random forest yields marginally higher accuracy, while logistic regression offers superior interpretability and transparency. Given the minimal performance gap, logistic regression may be preferable in clinical contexts where interpretability and trust are paramount. Future research should evaluate these methods on larger, multi-center datasets and explore enhanced interpretability techniques for ensemble models.
References
[1] L. Breiman, "Random forests," Machine Learning, vol. 45, no. 1, pp. 5–32, 2001.
[2] R. Couronné, P. Probst, and A.-L. Boulesteix, "Random forest versus logistic regression: a large-scale benchmark experiment," BMC Bioinformatics, vol. 19, no. 1, p. 270, 2018.
[3] I. Ozcan, H. Aydin, and A. Cetinkaya, "Comparison of classification success rates of different machine learning algorithms in the diagnosis of breast cancer," Asian Pacific Journal of Cancer Prevention, vol. 23, no. 10, pp. 3287–3297, 2022.
[4] P. Schober and T. R. Vetter, "Logistic regression in medical research," Anesthesia & Analgesia, vol. 132, no. 2, pp. 365–366, 2021.
[5] W. Wolberg, O. Mangasarian, N. Street, and W. Street, "Breast Cancer Wisconsin (Diagnostic) Data Set," UCI Machine Learning Repository, 1993.
February 15, 2026 at 05:56 PM
The conclusion states that both models "achieve near-perfect classification performance on the Wisconsin Diagnostic Breast Cancer dataset", but this statement is poorly supported by the evaluation protocol: a single stratified split/evaluation. Since this limitation is explicitly acknowledged in Section D, the author may want to make this point clearer. Also, the notions of interpretability and transparency adopted by the author, which are varied and not consistent throughout the literature on machine learning, should be explicitly described. In other words, the reader should ideally be able to measure interpretability and transparency to reproduce the evidence supporting the claim about the "superior interpretability and transparency" of one model over another.
February 15, 2026 at 06:58 AM
Some major inconsistencies are present: Table I reports ROC–AUC = 99.60% (LR) and 99.29% (RF). The paragraph immediately below claims “AUC values exceeding 0.99”. But Figure 1’s legend shows Logistic (AUC = 0.92) and RandomForest (AUC = 0.94). These cannot all be correct simultaneously. This is the biggest factual inconsistency in the paper because it affects the core headline result (near-perfect separability vs merely “good”). It also creates a secondary inconsistency about which model is better on AUC: Table I: LR AUC > RF AUC (99.60% > 99.29%). Figure 1: RF AUC > LR AUC (0.94 > 0.92). Also, coefficient/odds-ratio interpretation conflicts with the stated preprocessing. The paper states that logistic regression uses standardized features (mean 0, variance 1). But it then says exponentiated coefficients allow clinicians to interpret “unit increases in features (e.g., tumor area)”