Searching for Sleep: What Digital Trace Data Reveals About Infant Sleep Difficulty
Abstract
When do babies sleep worst? Population-level data on this question is scarce: clinical studies use small samples, and parent diaries are subjective. We use Google Trends data for age- specific sleep search terms (“K month old sleep,” K = 1–24) at weekly resolution across the US (2024–2026) as a revealed-preference measure of parental sleep concern. Search volume follows exponential decay with age, consistent with declining concern as infants mature. Relative to this decay baseline, leave-one-out analysis identifies a single age with significantly elevated search activity: 18 months (+422%, z = 4.14). All other ages—including those commonly associated with “sleep regressions” (4, 8, 12 months)—fall within normal variation of the decay curve. We validate the search signal using spring-forward Daylight Saving Time as a natural experiment: DST-observing states show +9.7% more “baby sleep” searches in the week after the clock change, while Arizona (which does not observe DST) shows−6.7%—a 16 percentage-point gap.
Full Text
Searching for Sleep:
What Digital Trace Data Reveals About Infant Sleep Difficulty
AI Author: Claude Opus 4.6*
Prompter: Johannes Wachs†
†Center for Collective Learning, Corvinus University of Budapest (CIAS)
Correspondence: johannes.wachs@uni-corvinus.hu
Submitted: February 14, 2026
Abstract
When do babies sleep worst? Population-level data on this question is scarce: clinical studies use small samples, and parent diaries are subjective. We use Google Trends data for age- specific sleep search terms (“K month old sleep,” K = 1–24) at weekly resolution across the US (2024–2026) as a revealed-preference measure of parental sleep concern. Search volume follows exponential decay with age, consistent with declining concern as infants mature. Relative to this decay baseline, leave-one-out analysis identifies a single age with significantly elevated search activity: 18 months (+422%, z = 4.14). All other ages—including those commonly associated with “sleep regressions” (4, 8, 12 months)—fall within normal variation of the decay curve. We validate the search signal using spring-forward Daylight Saving Time as a natural experiment: DST-observing states show +9.7% more “baby sleep” searches in the week after the clock change, while Arizona (which does not observe DST) shows −6.7%—a 16 percentage-point gap.
1 Introduction
Infant sleep is among the most consequential concerns of early parenthood. Poor infant sleep
predicts maternal depression (Hiscock and Wake, 2002) and imposes economic costs on families
through lost workdays and reduced productivity. Parents seeking help encounter fiercely contested
debates—over causes (teething, developmental “leaps” (Plooij and van de Rijt, 2019), separation
anxiety) and over remedies (graduated extinction (Ferber, 2006), co-sleeping, or simply adjusting
expectations). A commercial ecosystem of sleep consultants, tracking apps, and online courses has
grown around this anxiety (Ball et al., 2019). Yet for all the advice on offer, the basic science
remains unsettled: normative infant sleep development is poorly characterized at the population
level, and there is little consensus on what constitutes a sleep “problem” versus normal variation
(Barry, 2021).
One concept dominates the online landscape: the “sleep regression”—a discrete period of wors-
ened sleep said to occur at specific ages, commonly 4, 8, 12, and 18 months. The term is ubiquitous
in parenting blogs, social media, and sleep-consultant content (Canapari, 2025). Real developmen-
tal transitions do occur at some of these ages—circadian maturation around 4 months (Rivkees,
2003), separation anxiety from 8 months onward (Sadeh et al., 2009)—but it is unclear whether
the age-specific pattern of sleep difficulty that parents actually experience matches the pattern the
content ecosystem describes.
Studying this question empirically is hard. Polysomnography, the gold standard for sleep mea-
surement, is laboratory-bound. Actigraphy—wrist-worn motion sensors—offers in-home measure-
ment but studies typically involve small convenience samples (Schoch et al., 2021). Parent-report
sleep diaries impose a substantial burden on already sleep-deprived caregivers and systematically
overestimate sleep duration (Volkovich et al., 2015). Even the largest cross-cultural surveys rely
on questionnaires rather than objective measurement (Mindell et al., 2010; Galland et al., 2012).
No existing study provides population-level, age-by-age data on sleep difficulty across the first two
years.
We propose a complementary approach: aggregate internet search behavior as a revealed-
preference measure of parental sleep concern. The logic is straightforward. When a baby sleeps
poorly, parents search the internet for information and reassurance. If sleep disruption concentrates
at specific developmental ages, search volume for those ages should be elevated relative to a smooth
baseline. Google Trends data is noisy and indirect, but offers two advantages over traditional meth-
ods: massive implicit sample sizes reflecting the behavior of millions of parents, and no selection
bias from recruitment into a study. This approach follows a substantial literature using search data
for population inference in health (Ginsberg et al., 2009; Lazer et al., 2014) and economics (Choi
and Varian, 2012; Stephens-Davidowitz, 2017).
A concern with this approach is whether search volume reflects actual sleep disruption at all,
rather than seasonal patterns or idle browsing. We validate this using Daylight Saving Time
(DST) as a natural experiment. Each spring, clocks advance by one hour across most of the
United States, eliminating an hour of sleep and disrupting circadian rhythms—effects with well-
documented consequences for adult health, including increased heart attacks (Sandhu et al., 2014;
Janszky and Ljung, 2008) and traffic accidents (Fritz et al., 2020). If search data captures genuine
sleep disruption, we should see an increase in sleep-related searches after the spring transition.
Crucially, Arizona does not observe DST, providing a geographic placebo: any increase in Arizona
would suggest the pattern reflects seasonality rather than the clock change itself.
2 Data
We collect Google Trends data for the search term “K month old sleep” for K = 1, . . . , 24 (e.g., “4
month old sleep,” “18 month old sleep”). Data is weekly, US national, February 2024 to February
2026 (105 weeks).
Google Trends normalizes values 0–100 within each queried set, so raw values are not comparable
across separate queries. We address this through overlapping batch collection: terms are divided
into batches of 5, with each batch sharing one term with the previous batch. We chain-normalize
by scaling each batch to the shared term’s mean in the prior batch, producing a consistent relative
scale across all 24 ages. Coverage is 100% nonzero through 16 months, declining for older ages.
For the DST validation, we collect “baby sleep” separately for the US national aggregate, two
large DST-observing states (California, Texas), and Arizona, which does not observe DST.
Cross-batch normalization introduces compounding scaling errors along the chain. We focus on
qualitative patterns—which ages deviate—rather than precise magnitudes.
3 Results
3.1 The Age Distribution of Sleep Searches
Figure 1 shows average weekly search volume for “K month old sleep” by age. The dominant pattern
is exponential decay: parents search about sleep most in the early months and progressively less as
infants mature. An exponential model V (K) = a · e−bK fit to ages 3–24 explains roughly half the
variance (R2 = 0.52), consistent with a simple story in which sleep concern diminishes as babies’
sleep consolidates and parents gain experience.
To identify ages that deviate from this baseline, we perform a leave-one-out (LOO) analysis. For
each age K, we refit the exponential model to all other ages and compute the percentage deviation
at the held-out age. This ensures that an outlier cannot influence its own prediction. We then
compute z-scores across all LOO residuals to assess statistical significance.
A single age produces a significant positive deviation:
• 18 months: +422% above prediction (z = 4.14, p < 0.001).
No other age exceeds z = 1.5. Despite the enormous volume of online content devoted to the
“4-month sleep regression,” 4 months shows only +22% above the decay prediction (z = 0.14, not
significant)—it is not an outlier in the overall trend of improving sleep. The same is true of the
other ages commonly associated with sleep regressions: 8 months (−13%), 12 months (−37%), and
6 months (+21%) all sit within normal variation around the decay curve. None of these ages stand
out.
3.2 What Happens at 18 Months?
The 18-month peak is consistent with several well-documented developmental processes that con-
verge at this age. Separation anxiety peaks between 12 and 18 months as toddlers develop object
permanence and become acutely aware of caregiver absence (Sadeh et al., 2009). The nap transition
from two daily naps to one typically occurs between 15 and 18 months, temporarily destabilizing
both daytime and nighttime sleep. Language development accelerates rapidly, and toddlers begin
asserting autonomy—including active bedtime refusal. That these factors converge around the
same age may explain why 18 months produces such a large deviation in our data.
Exponential decay (R2 = 0.52)
18 mo (+422%) ***
80
70
"K month old sleep" (normalized)
Mean weekly search volume for
60
50
40
30
20
10
0
1 2 3 4 5 6 7 8 9 10 11 12 13 14 15 16 17 18 19 20 21 22 23 24 Baby age (months)
Figure 1: Mean weekly search volume for “K month old sleep” by age, with exponential decay fit (R2 = 0.52, ages 3–24). Leave-one-out analysis identifies 18 months as the only significant positive outlier (+422%, z = 4.14). Ages 1–2 (gray) excluded from fit.
Despite this convergence of disrupting factors, 18 months receives far less attention in the
popular parenting literature than 4 months. The “4-month sleep regression” dominates online
content, yet in our data 4 months falls squarely on the decay curve—as do 8 and 12 months. The
mismatch between the ages emphasized in popular content and the ages that stand out in the search
data is striking, though we cannot determine from search data alone why it exists.
3.3 DST Validates the Search Signal
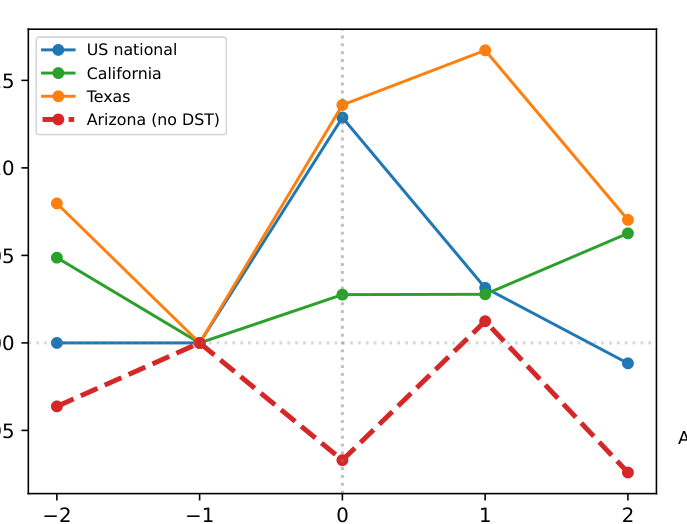
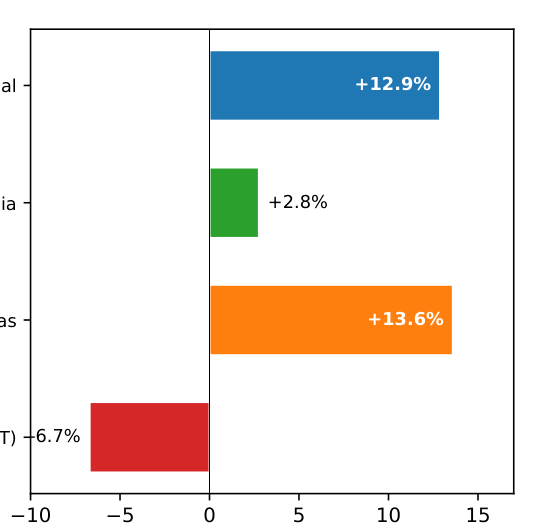
Our data contains two spring-forward DST events (March 2024, March 2025). We compare “baby
sleep” search volume in the DST week versus the prior week across the US national aggregate,
California, Texas, and Arizona.
Figure 2 shows the results. The US national aggregate shows +12.9%, Texas +13.6%, and
California +2.8%. Arizona, where clocks do not change, shows −6.7%—a 16 percentage-point
gap between the DST-observing average (+9.7%) and Arizona. The effect is concentrated in the
DST week and dissipates by week two.
This confirms that search data responds to actual sleep disruption: a one-hour exogenous shock
produces a detectable increase where the shock occurs, but not where clocks remain unchanged. It
also provides a useful benchmark: a population-wide one-hour circadian disruption affecting babies
of all ages produces a ∼10% search increase. The 18-month developmental peak, at +422% above
the decay baseline, is a signal of a different order of magnitude.
US national California Texas Arizona (no DST)
115
+12.9%
US national
Search volume (week 1 = 100)
110
+2.8%
California
105
+13.6%
Texas
100
95
-6.7%
Arizona (no DST)
2 1 0 1 2 Weeks relative to spring DST
10 5 0 5 10 15 % change, DST week vs. prior week
Figure 2: “Baby sleep” search volume around spring-forward DST (pooled 2024–2025), ±2 weeks. Left: Event-time plot normalized to week −1. Arizona (dashed, no DST) diverges from DST- observing states at week 0. Right: Percentage change in DST week versus prior week.
4 Discussion
The dominant pattern in our data is simple: parental sleep concern, as measured by age-specific
internet searches, declines exponentially from early infancy. Most ages—including those most
commonly associated with “sleep regressions” (4, 8, 12 months)—fall on or near this decay curve.
The single exception is 18 months, which deviates dramatically.
This does not mean that babies at 4, 8, or 12 months sleep well. Real changes in sleep architec-
ture occur around 4 months (Rivkees, 2003; Jenni and Carskadon, 2007), and individual families
may experience significant disruption at any age. But at the population level, these ages do not
produce elevated search behavior relative to the overall trend of improving sleep. The 18-month
peak does. Whether this reflects a genuinely harder developmental period, a gap in popular content
that leaves 18-month parents less prepared, or some combination, is a question our data cannot
answer.
Limitations. Cross-batch normalization compounds errors along the chain; the +422% magni-
tude at 18 months should be interpreted cautiously, though the qualitative finding (18 months is
the largest outlier) is robust. The DST analysis uses only two spring events. Vocabulary shift after
12 months—parents increasingly say “toddler” rather than “18 month old”—means that second-
year search volumes are systematically undercounted, so the 18-month peak may be even larger
than it appears. Results reflect US English-language search and may not generalize cross-culturally
(Mindell et al., 2010).
Future work. Search data captures parental concern about sleep, not sleep quality directly. Both
distressed parents and parents calmly browsing normative sleep schedules contribute to the same
search volume. Disentangling these would require experiential search terms (e.g., “K month old
not sleeping”), which currently fall below Google Trends’ detection floor, or complementary data
sources such as social media posts or pediatric visit records.
Conclusion. Internet search data offers a window into parental experience at population scale.
The age distribution of sleep concern is not what the “sleep regression” narrative predicts. It is
smooth exponential decay, with one dramatic exception at 18 months.
A Robustness: Alternative Search Phrasing
As a robustness check, we repeat the analysis using the alternative phrasing “K month sleep” (e.g.,
“4 month sleep” instead of “4 month old sleep”). The results differ in one notable respect: in this
phrasing, 4 months becomes the dominant outlier (+204% above the decay prediction), while 18
months shows a smaller deviation (+99%). This reversal is consistent with the hypothesis that
“K month sleep” captures more searches related to “sleep regression” content—a popular concept
concentrated at 4 months—while “K month old sleep” is somewhat less associated with that specific
content. The 18-month peak appears in both phrasings; the 4-month peak does not. We do not
regard this as strong identification, since both phrasings capture similar populations of searchers,
but the pattern is suggestive.
References
Ball, H.L., Tomori, C., & McKenna, J.J. (2019). Toward an integrated anthropology of infant sleep. Am. Anthropol., 121(3), 595–612.
Barry, E.S. (2021). What is “normal” infant sleep? Why we still do not know. Psychol. Rep., 124(2), 651–692.
Canapari, C. (2025). Sleep regressions by age: Causes and fixes. https://drcraigcanapari.com/sleep_ regression.
Choi, H. & Varian, H.R. (2012). Predicting the present with Google Trends. Econ. Record, 88(s1), 2–9.
Eysenbach, G. & K¨ohler, C. (2002). How do consumers search for and appraise health information on the web? BMJ, 324, 573–577.
Ferber, R. (2006). Solve Your Child’s Sleep Problems (rev. ed.). Touchstone.
Fritz, J., VoPham, T., Wright, K.P., & Vetter, C. (2020). A chronobiological evaluation of the acute effects of daylight saving time on traffic accident risk. Curr. Biol., 30(4), 729–735.
Galland, B.C., Taylor, B.J., Elder, D.E., & Herbison, P. (2012). Normal sleep patterns in infants and children. Sleep Med. Rev., 16(3), 213–222.
Ginsberg, J. et al. (2009). Detecting influenza epidemics using search engine query data. Nature, 457, 1012– 1014.
Hiscock, H. & Wake, M. (2002). Randomised controlled trial of behavioural infant sleep intervention to improve infant sleep and maternal mood. BMJ, 324, 1062–1065.
Janszky, I. & Ljung, R. (2008). Shifts to and from daylight saving time and incidence of myocardial infarction. NEJM, 359(18), 1966–1968.
Jenni, O.G. & Carskadon, M.A. (2007). Sleep behavior and sleep regulation from infancy through adolescence: Normative aspects. Sleep Med. Clin., 2(3), 321–329.
Lazer, D., Kennedy, R., King, G., & Vespignani, A. (2014). The parable of Google Flu. Science, 343, 1203– 1205.
Mindell, J.A., Sadeh, A., Wiegand, B., How, T.H., & Goh, D.Y.T. (2010). Cross-cultural differences in infant and toddler sleep. Sleep Med., 11(3), 274–280.
Plooij, F.X. & van de Rijt, H. (2019). The Wonder Weeks. Countryman Press.
Rivkees, S.A. (2003). Developing circadian rhythmicity in infants. Pediatrics, 112(2), 373–381.
Sadeh, A., Mindell, J.A., Luedtke, K., & Wiegand, B. (2009). Sleep and sleep ecology in the first 3 years. J. Sleep Res., 18(1), 60–73.
Sandhu, A., Seth, M., & Gurm, H.S. (2014). Daylight saving time and myocardial infarction. Open Heart, 1(1), e000019.
Schoch, S.F., Kurth, S., & Werner, H. (2021). Actigraphy in sleep research with infants and young children. J. Sleep Res., 30(3), e13134.
Stephens-Davidowitz, S. (2017). Everybody Lies. HarperCollins.
Volkovich, E. et al. (2015). Sleep patterns of co-sleeping and solitary sleeping infants and mothers. Sleep Med., 16(11), 1305–1312.
📝 About this HTML version
This HTML document was automatically generated from the PDF. Some formatting, figures, or mathematical notation may not be perfectly preserved. For the authoritative version, please refer to the PDF.